จำนวน Repository ( 1174 )

Creating and Evaluating the Effectiveness of Computer Assisted Instruction Program for Courses of Practiced of Reading Vernier Calliper 0.02 mm and 0.001 Inch
The purposes of the research were to create and efficiency validation of computer assisted for the courses of practiced to reading vernier caliper 0.02 m.m. and 0.001 inch based standard 90 / 90 and analyse the leaning achievement of the student after by using computer assisted instruction. The subjects in the study were 17 first year diploma students enrolled in Rajamangala University of Technology Phra Nakhon. The Researcher using the experiment by let the students do until test before class And then study by using computer assisted instruction focused on practiced to basic turning . After that let students do the unit test again at the class and calculate to find out the efficiency of the computer assisted instruction and analyse the leaning achievement of students after study. The research result revealed that the efficiency of the computer assisted Instruction was efficient in standard 90 / 90 Moreover after learning achievement At significant level of 0.05
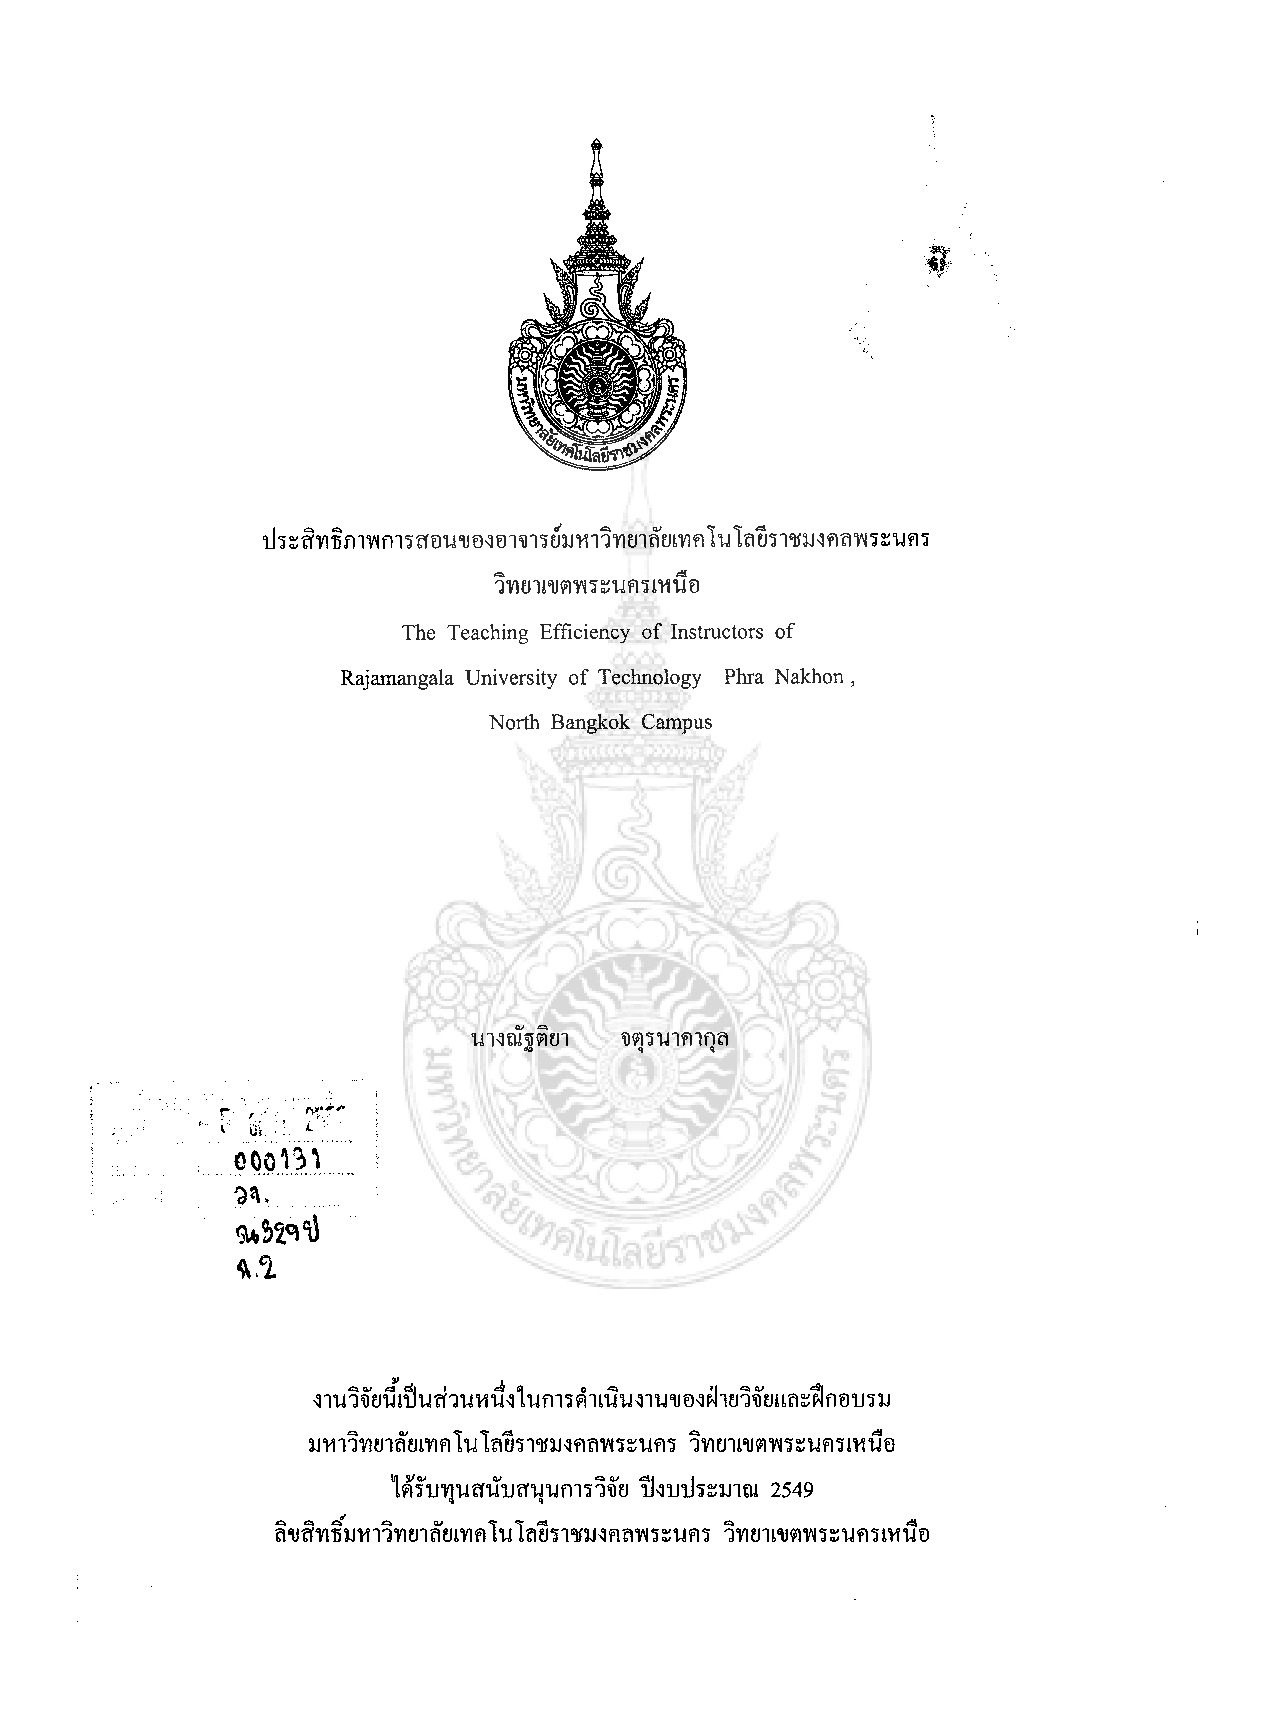
The Teaching Efficiency of Instuctors of Rajamangala University of Technology Phra NakhonNorth Bangkok Campus
The purposes of this study were to examine the teaching efficiency of instructors of Rajamangala University of Technology Phra Nakhon North Bangkok Campus in six Factors such as Knowledges Teaching Using of teaching aids Personalities the Relationship between Instructors and Students and Assessment. The sample included 334 Bachelor Degree Students of Rajamangala University of Technology Phra Nakhon North Bangkok Campus of the academic year 2005. The variables were studied and classified into vocational staffs and General Education Staffs. The data was collected using a five-point Likert type questionnaire. The questionnaires were distributed to the samples and 100 per cent were returned. The mean standard deviation and t-test were Statistical methods applied it was fond that the ottal efficiency of instructor teaching in six factors : Vocational and General Education staffs were high for each item it was implied that the teaching efficiency of Vocational Staffs were high: but that of General Education Staffs were averaged i item 4 : Reviewing and item 5 ; Summarizing. The total efficiency of instructors teaching in 6 aspects suggested that they were significantly over rveraged at .01 level. The total efficiency of instructor knowledge were significant different at .01 lever. for each item ti was found that they were significantly different at .01 lever in item 2 Example giving item 3 Question answering and item 5 : lmplications. The total efficiency of instructors teaching were significant different at .01 level. for each item it was found that they were significantly different at .01 level in Teaching Factor ; item 1 : Student questioning and answering item 2 : Teaching by seguential order item 4 : Reviewing Item 5 : Summarizing item 6 : Appropriated teaching pedagogy item 7 Adaptation of Teaching approach. The total efficiency of instructors teaching media was significantly different at .01 level. For each item found that it was significantly different at .01 level in Teaching Media Factor; item 1 : Suited for the students abilities and knowledge item 2 : interesting and modern media item 3 : Media Preparation and item 6 :The media assisting students to understand the lessons. The total efficiency of Relationship between Instructors and Students was significantly different at .01 level For each item it was found that they were significantly different at .01 level in Relationship betweeen Instructors and Students factor ; as in item 2 : Students name Membering item 3 : Students Knowledge follow up and item 5 : Students Counselling. For the efficiency of instructors Personality and Assessment Factor there was no different by totally and each item
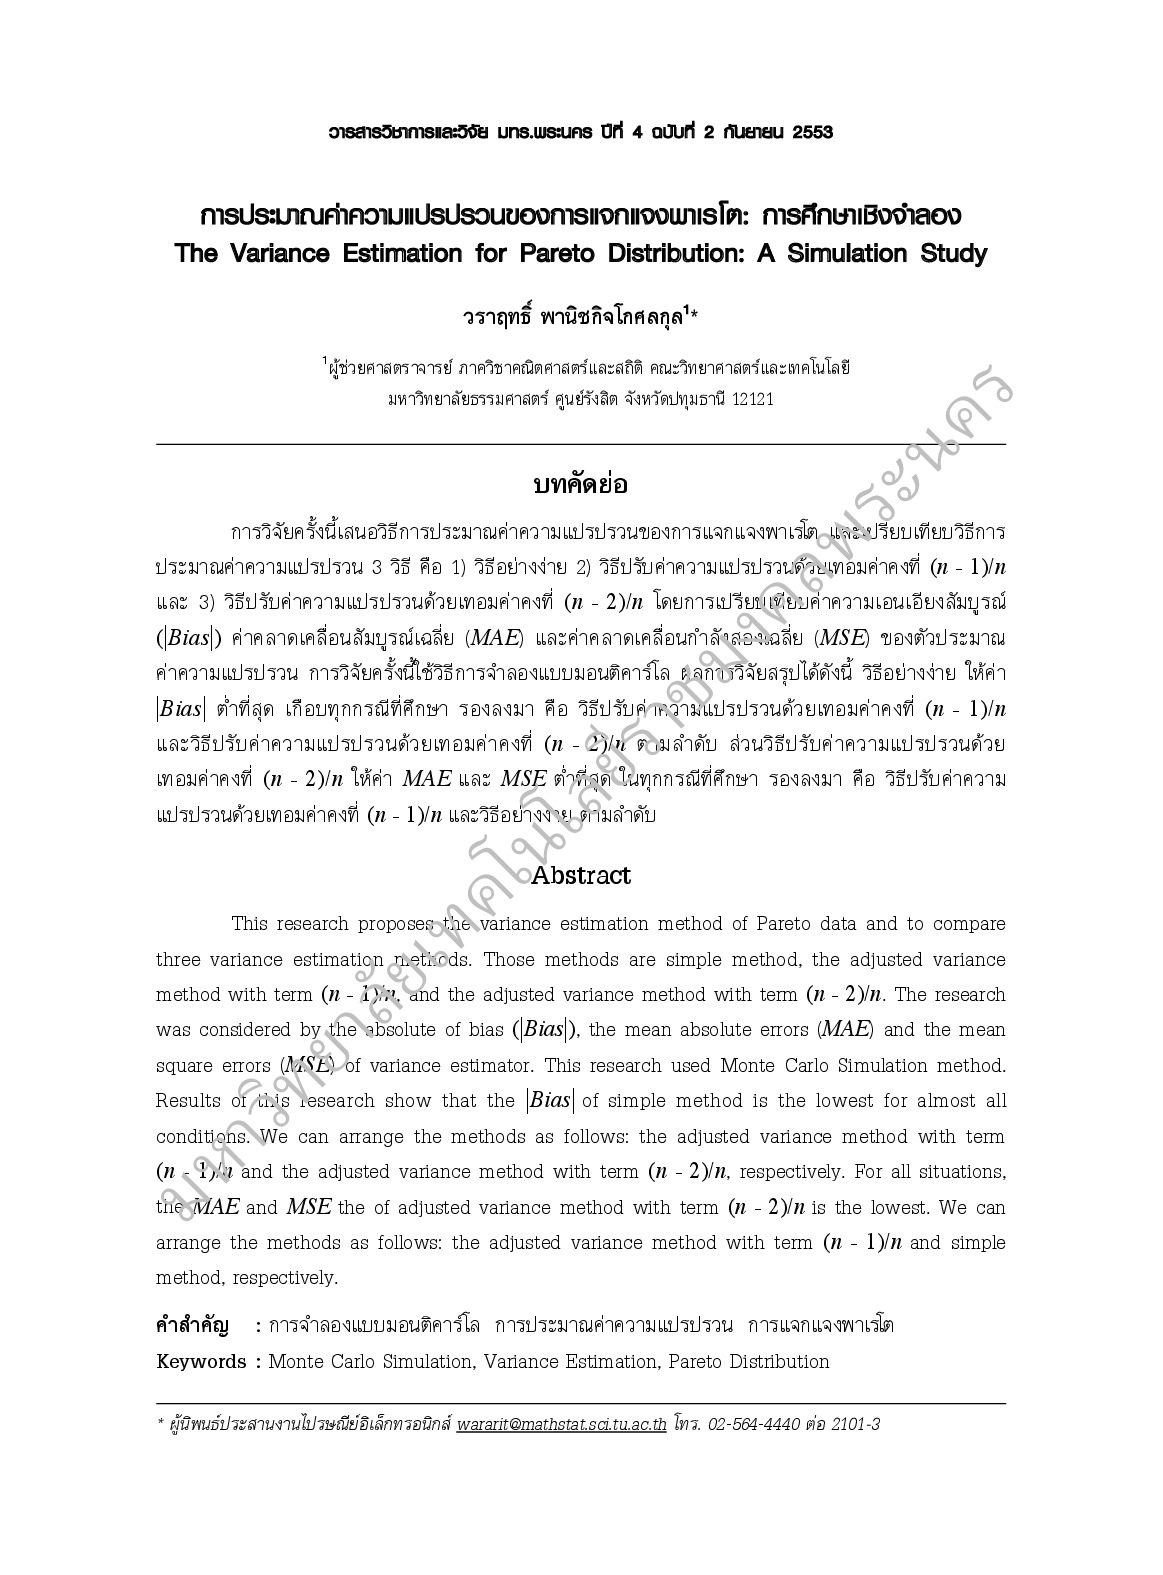
การประมาณค่าความแปรปรวนของการแจกแจงพาเรโตะ : การศึกษาเชิงจำลอง
This research proposes the variance estimation method of Pareto data and to compare three variance estimation methods. Those methods are simple method the adjusted variance method with term (n - 1)/n and the adjusted variance method with term (n - 2)/n. The research was considered by the absolute of bias (|Bias|) the mean absolute errors (MAE) and the mean square errors (MSE) of variance estimator. This research used Monte Carlo Simulation method. Results of this research show that the |Bias| of simple method is the lowest for almost all conditions. We can arrange the methods as follows: the adjusted variance method with term (n - 1)/n and the adjusted variance method with term (n - 2)/n respectively. For all situations the MAE and MSE the of adjusted variance method with term (n - 2)/n is the lowest. We can arrange the methods as follows: the adjusted variance method with term (n - 1)/n and simple method respectively.
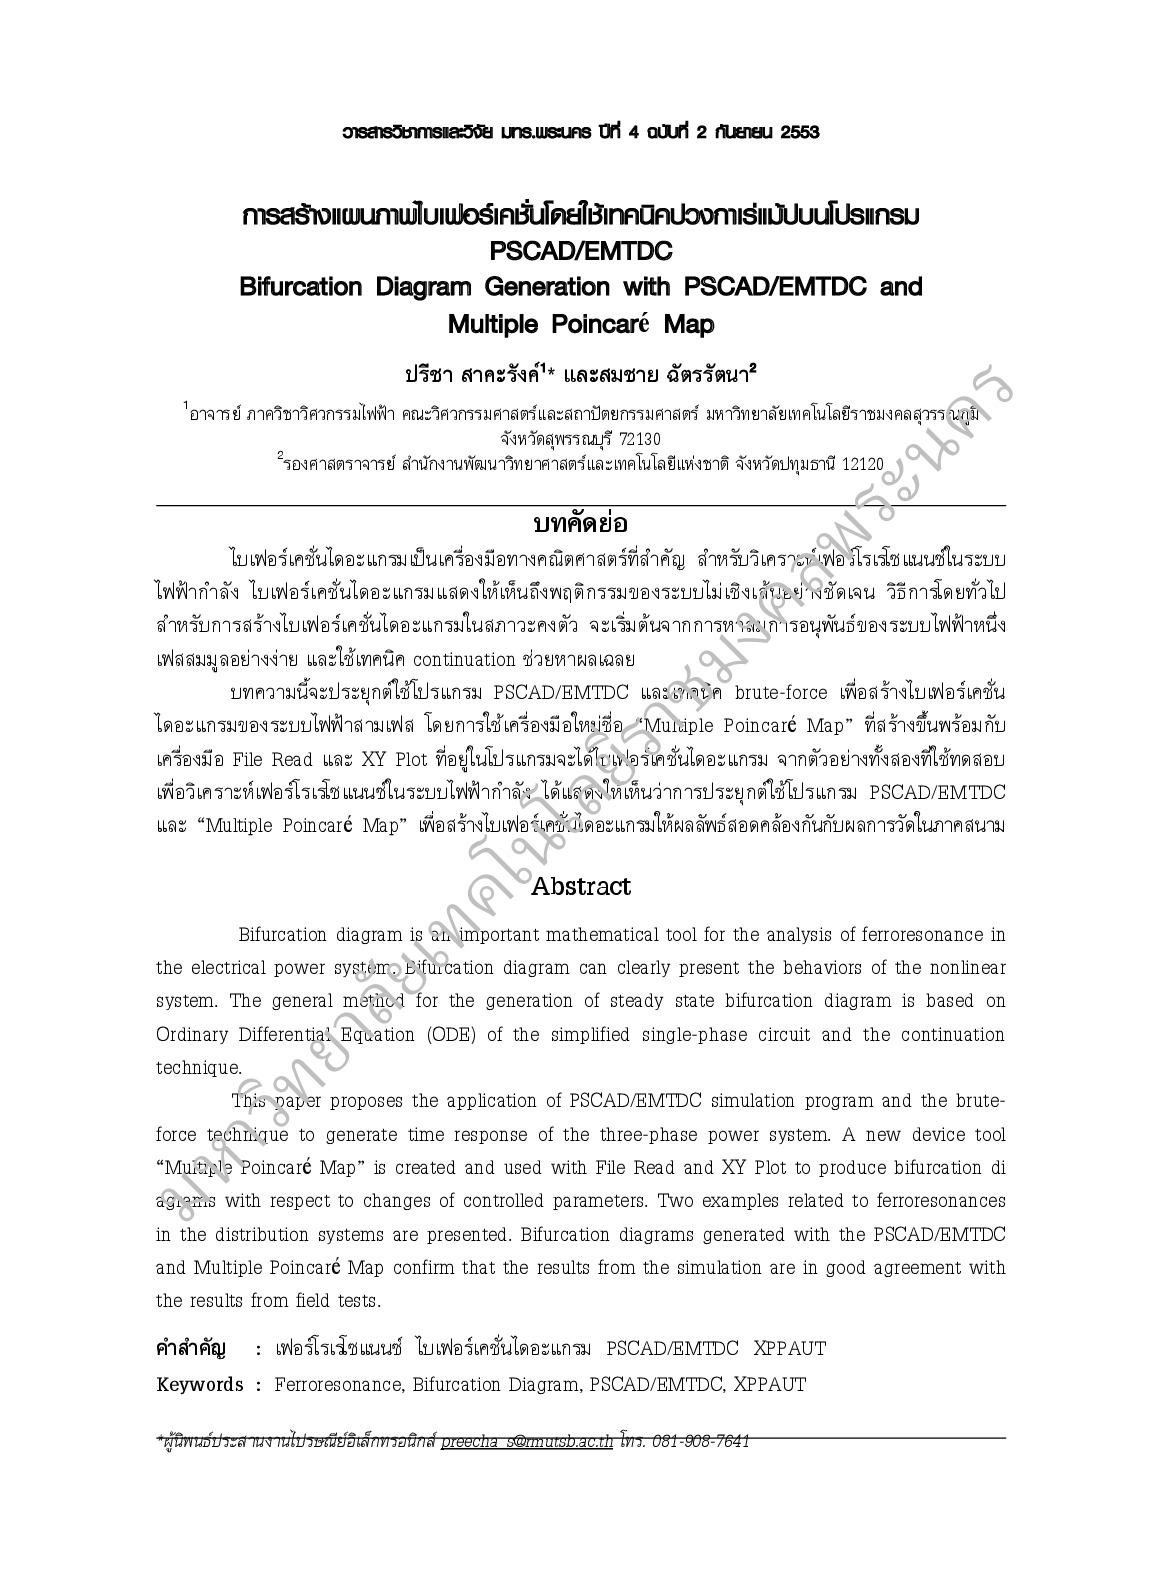
การสร้างแผนภาพไบเฟอร์เคชั่นโดยใช้เทคนิคปวงกาเร่แม้ปบนโปรแกรม PSCAD/EMTDC
Bifurcation diagram is an important mathematical tool for the analysis of ferroresonance in the electrical power system. Bifurcation diagram can clearly present the behaviors of the nonlinear system. The general method for the generation of steady state bifurcation diagram is based on Ordinary Differential Equation (ODE) of the simplified single-phase circuit and the continuation technique. This paper proposes the application of PSCAD/EMTDC simulation program and the bruteforce technique to generate time response of the three-phase power system. A new device tool “Multiple Poincaré Map” is created and used with File Read and XY Plot to produce bifurcation di agrams with respect to changes of controlled parameters. Two examples related to ferroresonances in the distribution systems are presented. Bifurcation diagrams generated with the PSCAD/EMTDC and Multiple Poincaré Map confirm that the results from the simulation are in good agreement with the results from field tests.
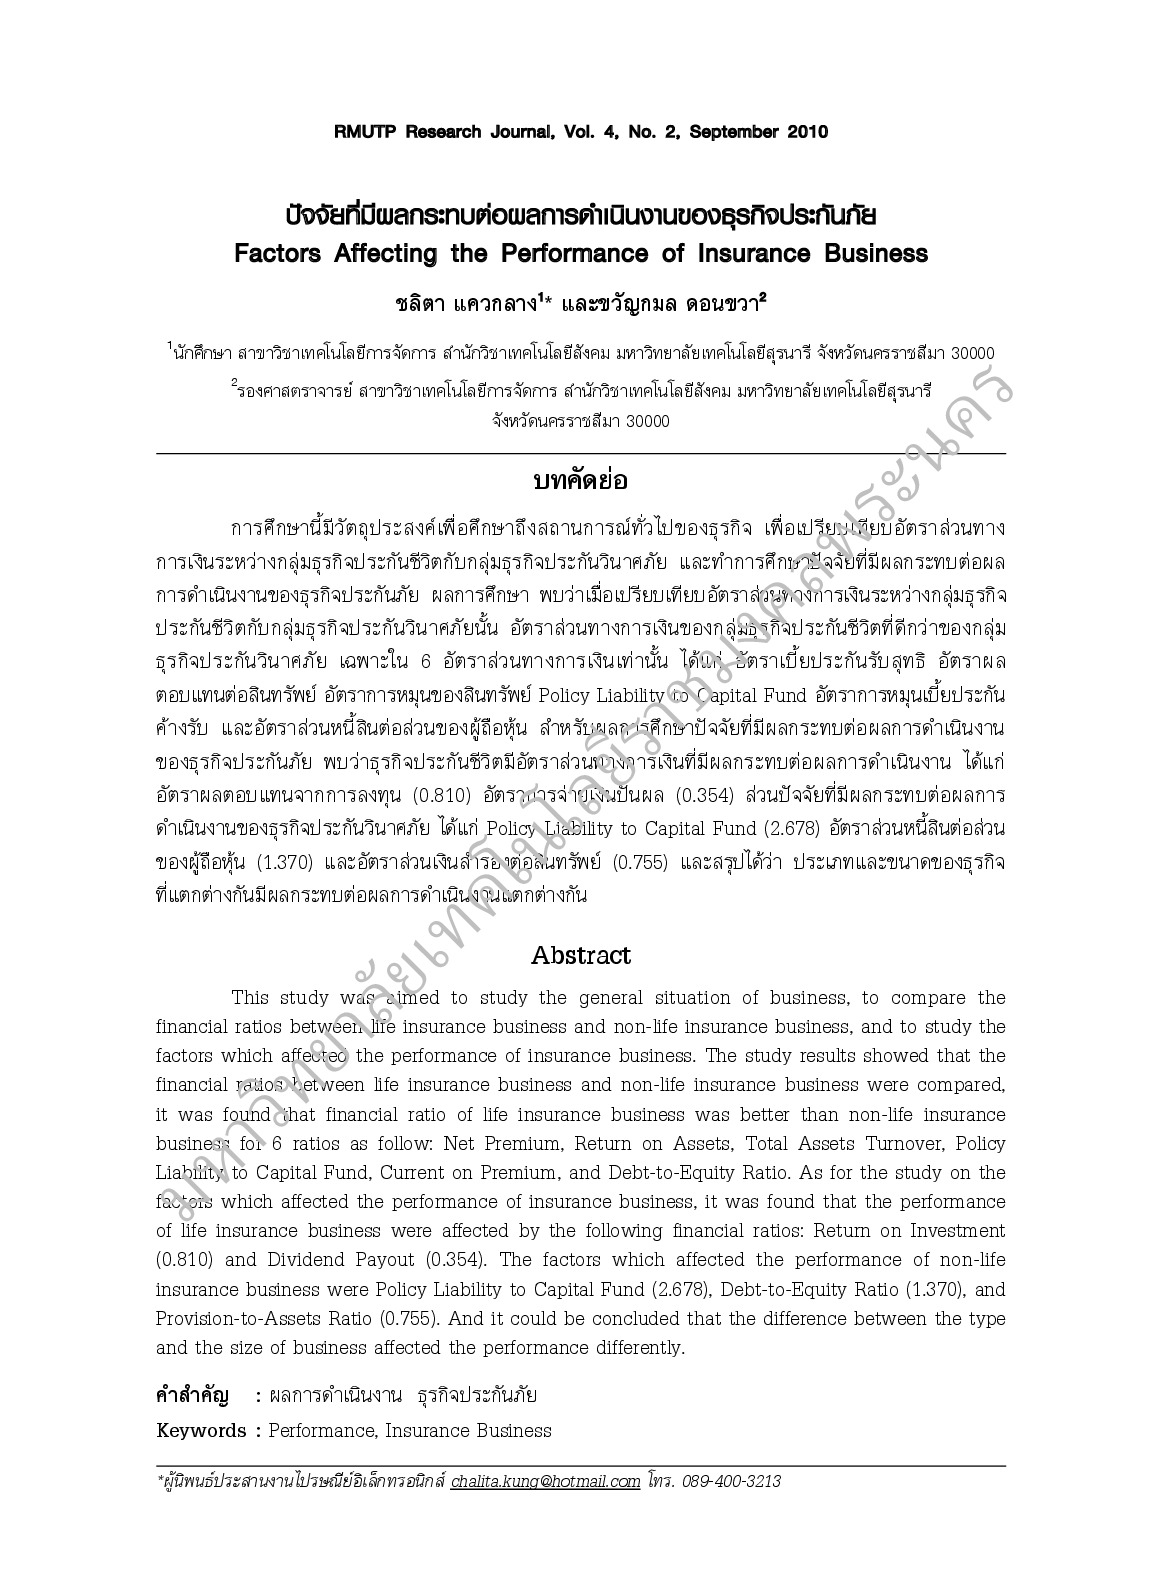
ปัจจัยที่มีผลกระทบต่อผลการดำเนินงานของธุรกิจประกันภัย
This study was aimed to study the general situation of business to compare the financial ratios between life insurance business and non-life insurance business and to study the factors which affected the performance of insurance business. The study results showed that the financial ratios between life insurance business and non-life insurance business were compared it was found that financial ratio of life insurance business was better than non-life insurance business for 6 ratios as follow: Net Premium Return on Assets Total Assets Turnover Policy Liability to Capital Fund Current on Premium and Debt-to-Equity Ratio. As for the study on the factors which affected the performance of insurance business it was found that the performance of life insurance business were affected by the following financial ratios: Return on Investment (0.810) and Dividend Payout (0.354). The factors which affected the performance of non-life insurance business were Policy Liability to Capital Fund (2.678) Debt-to-Equity Ratio (1.370) and Provision-to-Assets Ratio (0.755). And it could be concluded that the difference between the type and the size of business affected the performance differently.