จำนวน Repository ( 97 )

การประยุกต์การใช้พลังงานแบบผสมผสานเพื่อบูรณาการกับภาคการเกษตรกรรม
The application of integrated energy use in the agriculture sector It is presented in the form of using renewable energy from solar energy to produce electricity to use in conjunction with other sources of electricity such as generators or electric power systems. Using solar panels or solar cells the size and number of panels does not exceed 300 watts 4 panels and the electrical system of the electrical system. Supply electric power to the water pump size does not exceed the rating of 1500 watts 220 volts. Solar power supply systems alone may be affected by weather conditions or electrical power supplies. Including the quality of electricity obtained from solar energy and will result in the water pump not working efficiently. Therefore the application of solar energy by using a power supply system from 2 sources by using a hybrid inverter device to select the power supply from the solar cell is the main power and the power supply from the memory system is the backup power. Therefore a research project on the application of solar water pumps in a mixed system for agriculture is proposed to increase the efficiency of electric power distribution. This application of solar water pump hybrid system for agriculture when used with water pumps can normally help to save electricity and can also use solar energy instead of using electricity to pump water. Let the water pump and can work efficiently.
ขนมแก่นตะวันลดพลังงาน
Study on Energy – Reducing Jerusalem Artichoke Dessert The objective is to study the basic recipe of Jerusalem Artichoke dessert. And to study the level of sugar consumption in the 5 formulas of Jerusalem Artichoke 0% 25% 50% 75% and 100% By planning a randomized complete block design (RCBD) experiment the sensory quality in terms of appearance color smell taste texture and overall preferences was assessed by a (9 - point preference-scoring tasting method. Hedonic Scale) by a taster of 40 and 80 Who is a student in Food and Nutrition Faculty of Home Economics Technology Rajamangala University of Technology Phra Nakhon And bringthe information obtained To find the mean (x ̅) analyze the variance (Analysis of Variance ANOVA) and compare the mean difference by means of Least significant Difference (LSD) and Duncans New Multiple Range Test (DMRT). The results were analyzed by a statistical package. From studying the basic recipe of Jerusalem Artichoke Dessert The tasters accepted the basic recipe of Jerusalem Artichoke Dessert the second formula in terms of appearance color smell taste texture and overall preferences. The average score was 8.07 8.08 7.85 7.93 7.98 and 7.98 which were in the medium to high preference level. When it was analyzed the variance and compared the statistical differences. It was found that the appearance color taste and texture The difference was statistically significant at 0.05 level. And overall preferences There was no significant difference at the 0.05 level. From the study of reducing sugar content in Jerusalem Artichoke Dessert Energy - reducing Taster accepted the recipe 75% for appearance color flavor texture and overall preference. With an average score of 8.05 7.93 7.55 7.82 and 7.83 In the level of moderate to very favorable As for the smell The tasters accepted the recipe 50% with an average score of 7.52 being moderate. When the variance was analyzed and statistical differences were compared. It was found that the appearance color smell taste texture and overall preference. There was a statistically significant difference at the 0.05 level.
เทคนิคการวิเคราะห์คุณภาพกำไรของบริษัทจดทะเบียนในตลาดหลักทรัพย์แห่งประเทศไทยกลุ่มพลังงานและสาธารณูปโภค และกลุ่มปิโตรเคมีและเคมีภัณฑ์
The objective of this research is to study the techniques of profit quality analysis and the consistency of the profit quality with different profit quality analysis techniques; and to compare profit sustainability between large companies and small companies of the industrial energy and utilities group and the petrochemical and chemical group. The data is collected from financial statements and data entry forms (Form 56-1) from 2012 to 2018. A total of 47 companies are analyzed using descriptive statistics including mean and standard deviation; and inferential statistics including multiple regression analysis and analysis of the average difference between 2 groups The research found that in the analysis of the profit quality consistency in all 4 methods there were only 13 companies in the energy and utilities group with consistent quality of profits accounting for 39.39%; and 20 with inconsistent results accounting for 60.61%. In the petrochemical and chemical group there was only 1 company with consistent quality in all 4 methods representing 7.14%; and 13 companies with inconsistent quality representing 92.86%. In addition when comparing the profit sustainability between large companies and small companies it was found that there was no statistical difference in profit sustainability (sig = 0.305> 0.05). When comparing the profit sustainability between energy and utilities group and the petrochemical and chemical group it was found that petrochemical and chemical companies had a higher profit sustainability than the energy and utilities group at statistical significance of 0.01 (sig = 0.009 <0.01).
กลยุทธ์การประหยัดพลังงานในระบบทำความเย็นด้วยการจัดการระบบละลายน้ำแข็ง
Defrosting at evaporator panel is one of working cycles in freezer. Power consumption in defrosting does not meet the objective of using freezer therefore the approach to decrease power consumption in defrosting is one strategy for energy saving. Normally the cycle of defrosting in freezer is a constant time that specify by referring to the highest humidity period. With this control concept the problem of temperature exchange is not occurred from ice accumulation at evaporator panel but it makes the over necessity of defrosting process in the low humidity season and cause the unnecessary power usage in freezer. This thesis presents the control approach for defrosting by using the difference of the temperature at evaporator and the temperature at chilling area. By using this approach the defrosting process is operated depend on load and the fan is on or off relate to defrosting time. Test results demonstrate that about 12% of power can be saved by this control approach when compared to constant time control.
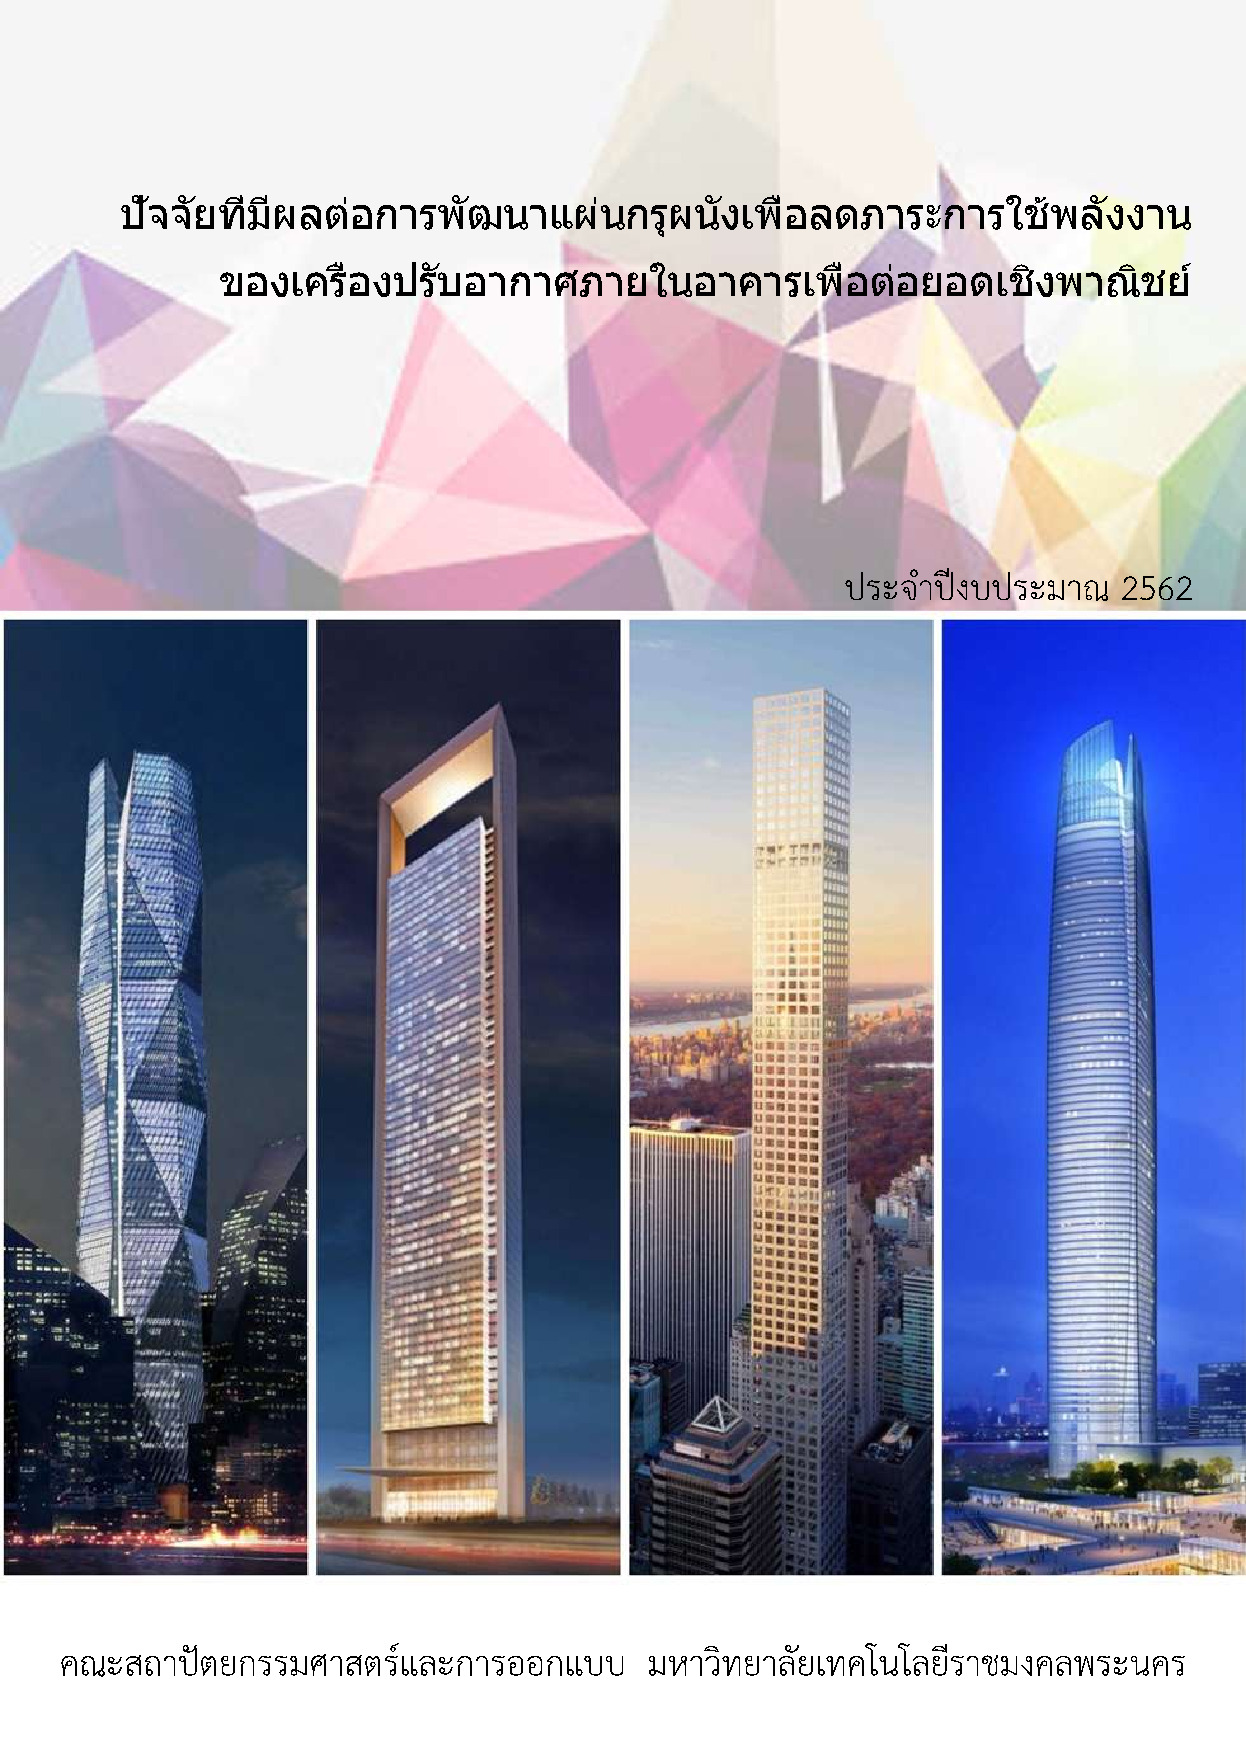
ปัจจัยที่มีผลต่อการพัฒนาแผ่นกรุผนังเพื่อลดภาระการใช้พลังงานของเครื่องปรับอากาศภายในอาคารเพื่อต่อยอดเชิงพาณิชย์
This research approach to study the development of interior wall for reduce energy consumption by air conditioning in the building. In order to be a prototype in the development of an industrial system for the export of green architecture in order to generate income for the community or entrepreneurs to bring money into the country to upgrade the industrial economy to be sustainable It is an architectural material that is compatible with the weather in Thailand. It can be used as a guideline for people interested in applying it to their own home building or disseminating through various media to reduce energy costs for a comfortable living. The objective is to study the factors that affect the development of wall paneling in order to reduce the energy burden of the air conditioner in the building in order to further the commercial production. The researcher collected data for the past 6 months not including other thermal energy. Used to calculate the energy consumption index for 2 building groups it was found that the electricity consumption of green buildings were 531100 kilowatt hours. And an average of 5.31 kilowatt hours per square meter While the non-green building has an average of 653360 kilowatt hours. And an average of 6.53 kilowatt hours per square meter As for the results of the data analysis the damage level is mostly at level 1 which is the wall surface and no obvious damage. Especially the 4th and 5th height is 1.55 meters and 1.85 meters from the floor level in the building. Damage level 3 is found at the height level 3 at a height of 1.00 meters from the floor level in the building. Assessment of damage caused to the interior wall of the building that occurred in 3 levels. The results of the data analysis showed that most damage levels were at level 1 namely the wall surface without obvious damage. Especially the 4th and 5th height is 1.55 meters and 1.85 meters from the floor level in the building. Damage level 3 is found at the height level 3 at a height of 1.00 meters and from the results of collecting moisture content in the exterior wall materials And analyzed to find the average for each of the 5 levels of height which are 0.55 meters 0.75 meters 0.95 meters 1.55 meters and 1.85 meters found that the buildings have different moisture content in each wall level (p <0.05). In conclusion this green building index equation can be applied to other buildings to reduce energy consumption and meet the standards of the green building. From the equation the electricity consumption can be predicted using the electricity usage index and systematically designed energy management in buildings. The area with the most damage will find the humidity in the range of 47% -98% the highest damage level 3 at an elevation of 0.80 meters from the floor level in the building