จำนวน Repository ( 1574 )

Study of effects of surface roughness 10 hardness test V2.Lv5
The objective of this work is to study the effect of the surface roughness on the measured hardness. The preparation of the surface roughness level complied with the ISO 1302: 1992 standard. There are many factors influencing surface roughness such as building mac uncry feed rate speed machine settings cutter and water cooling. The surface roughness C.tU. by these factors will have influence on the measured hardness of materials. The SKS3 is used as material in this study. Surface of the work piece was adjusted with different roughness val es divided following four levels: 12-50 urn rough machined 1.6-6.3 urn smooth turned 0.2-0.8 urn and 0.025-0.1 um. Then all the adjusted roughness work pieces were harden. After the Harden process the hardness of all work pieces were 62-64 HRC. From the measured hardness results it was found that the standard deviations are 4.665 1.0310.530 and 0.407 respectively with surface roughness value. Therefore it can be concluded that the standard deviation of hardness increased when the surface roughness increased
เครื่องคัดแยกขนาดเมล็ดสารกาแฟโรบัสต้า
In the procedure processes of Robusta coffee initial from bring the green coffee after dried and removed the outside shell and bring it to separating process. The sale price depends on the size of green coffee. If their size of still standard the sale price have been increased. Most of the separating process is majorly with the labor experience. Based on human experience the error with operating and working time is increased. In this reason we will study to the criteria of Robusta coffee for designing and creating the Robusta coffee bean separator machine for Robusta size standard testing. The separator machine consists of the three-layer cylindrical sieve set and the diameter of the layers was 4 6 and 7.5 mm. respectively. For the standardization of Robusta coffee bean is controlled by size of hole sieve. In this research considers to 4 importance parameters by the efficiency of sorting out standard of green coffee Specific Energy Consumption [SEC] and assessment way economic engineering. The result of research shows that the maximum efficiency of green coffee separating is 164.7 kg/hr under the condition of testing with 14.4 rpm at 4 angle incline. In term of standard it found that the machine can separated only for standard and smaller than standard size of green coffee and the maximum moistness are 9.9%. For the least Specific Energy Consumption [SEC] is 0.01631 MJ/kg and occur with the same condition of experiment. Based on this condition the Break-Even Point must be sorting out with 1070550 kilogram per year and Payback Period will occur at 3.598 years. However the quantity of separating or the efficiency of machine is mainly effect to Break-Even Point and Payback Period.
Creating and evaluating the effectiveness of computer assistedInstruction program subject manufacturing processes chapter 5-8.
The purposes of the research were to create and efficiency validation of computer Assisted for the courses of practiced to reading Creating and Evaluating the Effectiveness of Computer Assisted Instruction Program Subject Manufacturing Processes Chapter 5-8. based standard 90/90 and analyses the leaning achievement of the student after by using computer assisted instruction . The subjects in the study were 25 first year. Diploma students enrolled in Rajamangala University of Technology Phra Nakhon. The Researcher using the experiment by let the students do until test before class And then study by using computer assisted instruction focused on practiced to basic turning . After that let students do the unit test again at the class and calculate to find out the efficiency of the computer assisted instruction. And analyzed the learning achievement of students after study. The research result revealed that the efficiency of the computer assisted Instruction was efficient in standard 90/90 Moreover after learning achievement at significant level of 0.05.
Analysis of steel industries in thailand : Case study of production planning and control by determination of time limited free back orders.
The objectives of this research were to find the distribution of food demand for laying hens and to find the optimum amount of that food production which had minimum cost. The data consisted of customer purchase orders for the food of laying hens price of food for laying hens cost per unit for the food inventory cost related to food of laying hens in which the food was out of stock such as fine overtime urgent purchase for material. They were collected in 2008-2009 form a factory in Nakhonratchasima province. The collected data were analized in order to explore the distribution of the monthly food demand for the laying hens and to see the rate of inventory per unit. The results were used in the stochastic linear programming model for aggregate planning in which the optimum production minimum cost could be obtained. Programming algorithm in MATLAB and tools in Linprog software were used to get the solution. The distribution of the food demand for laying hens and the random numbers were used in the model. The study found that the distribution of food demand for laying hens every month has normal distribution (January to December). The monthly average amount of production from January to December were 10936.94 12913.74 11898.12 13096 15443.26 14916.33 10322.64 10818.21 11393.11 11700.72 9706.05 and 11702.05 respectively. The minimum total cost average for 12months was Baht 62422386.98.
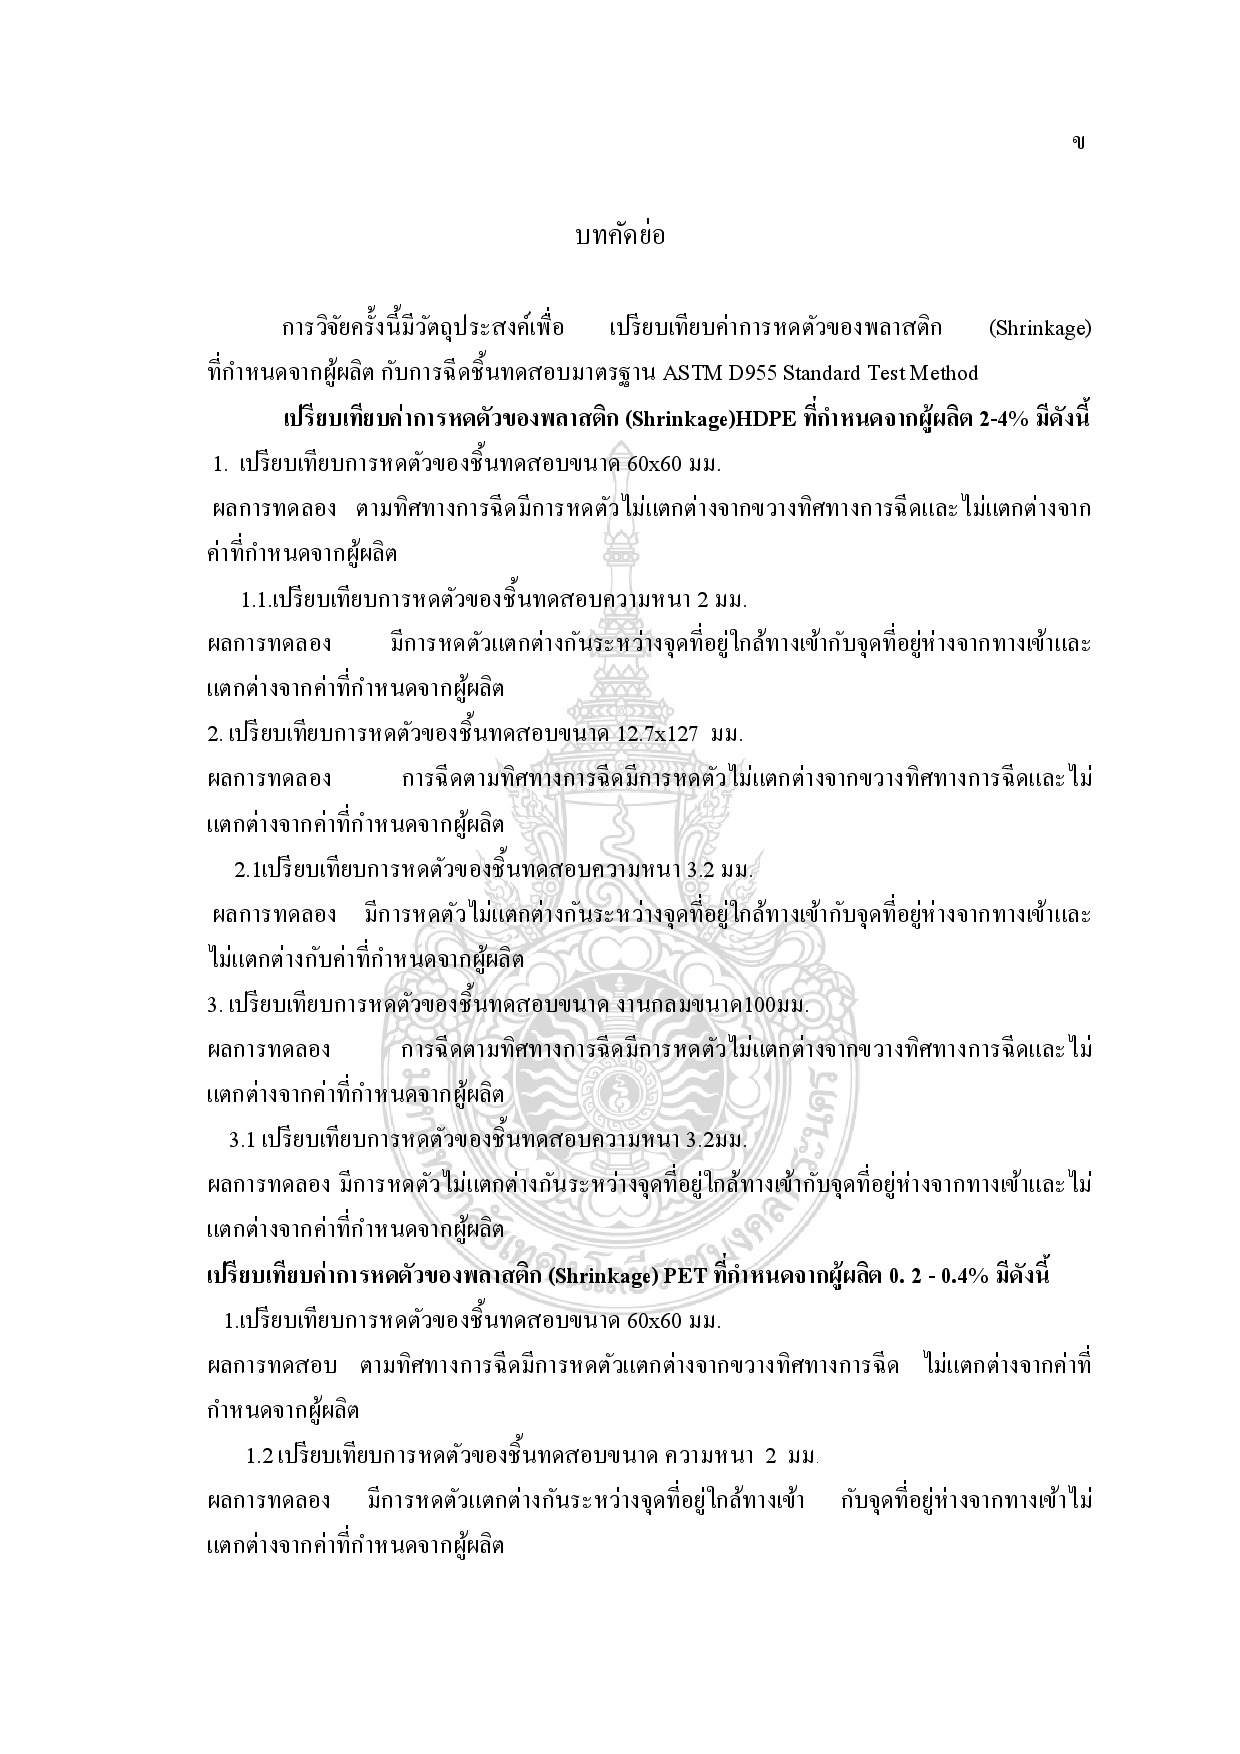
This research aims to compare the shrinkage value that limited from manufacturer with the ASTM D955 Standard Test Method
Comparing the shrinkage values of HDPE 2 – 4 % that limited from manufacturer are as the following: 1. Comparing the shrinkage of 60 X 60 mm. specimen The result showed that there aren’t any shrinkage differences among follow the injection across the injection and the limited value from the manufacturer. 1.1 Comparing the shrinkage of the specimen with 2 mm. thick The result showed that the shrinkage between at the point nearby the entrance is different from at the point further from the entrance and it is also different from the limited value from the manufacturer. 2. Comparing the shrinkage of 12.7 X 27 mm. specimen The result showed that there aren’t any shrinkage differences among follow the injection across the injection and the limited value from the manufacturer. 2.1 Comparing the shrinkage of the specimen with 3.2 mm. thick The result showed that there aren’t any shrinkage differences among the point nearby the entrance the point further from the entrance and the limited value from the manufacturer. 3. Comparing the shrinkage of 100 mm. round specimen The result showed that there aren’t any shrinkage differences among follow the injection across the injection and the limited value from the manufacturer. 3.1 Comparing the shrinkage of the specimen with 3.2 mm. thick The result showed that there aren’t any shrinkage differences among the point nearby the entrance the point further from the entrance and the limited value from the manufacturer. Comparing the shrinkage values of PET 0.2 - 0.4% that limited from manufacturer are as the following: 1. Comparing the shrinkage of 60 X 60 mm. specimen The finding revealed that the shrinkage value of the follow injection is different from the across injection but it is not different from the limited value from the manufacturer. 1.2 Comparing the shrinkage of the specimen with 2 mm. thick The finding revealed that the shrinkage value between the point nearby the entrance and the point further from the entrance are different but the same as the limitation from the manufacturer. 2. Comparing the shrinkage of 12.7 X 27 mm. specimen The finding revealed that the shrinkage value of the follow injection is different from the across injection but the same as the limited value from the manufacturer. 2.1 Comparing the shrinkage of the specimen with 3.2 mm. thick The result showed that there aren’t any shrinkage differences among follow the injection across the injection and the limited value from the manufacturer. 3. Comparing the shrinkage of 100 mm. round specimen The finding revealed that the shrinkage value of the follow injection is different from the across injection but it is not different from the limited value from the manufacturer. 3.1 Comparing the shrinkage of the specimen with 3.2 mm. thick The finding revealed that the shrinkage value of the follow injection the across injection and the limited value from the manufacturer are the same. Both comparing HDPE and PET have statistical significance at 0.05