จำนวน Repository ( 143 )
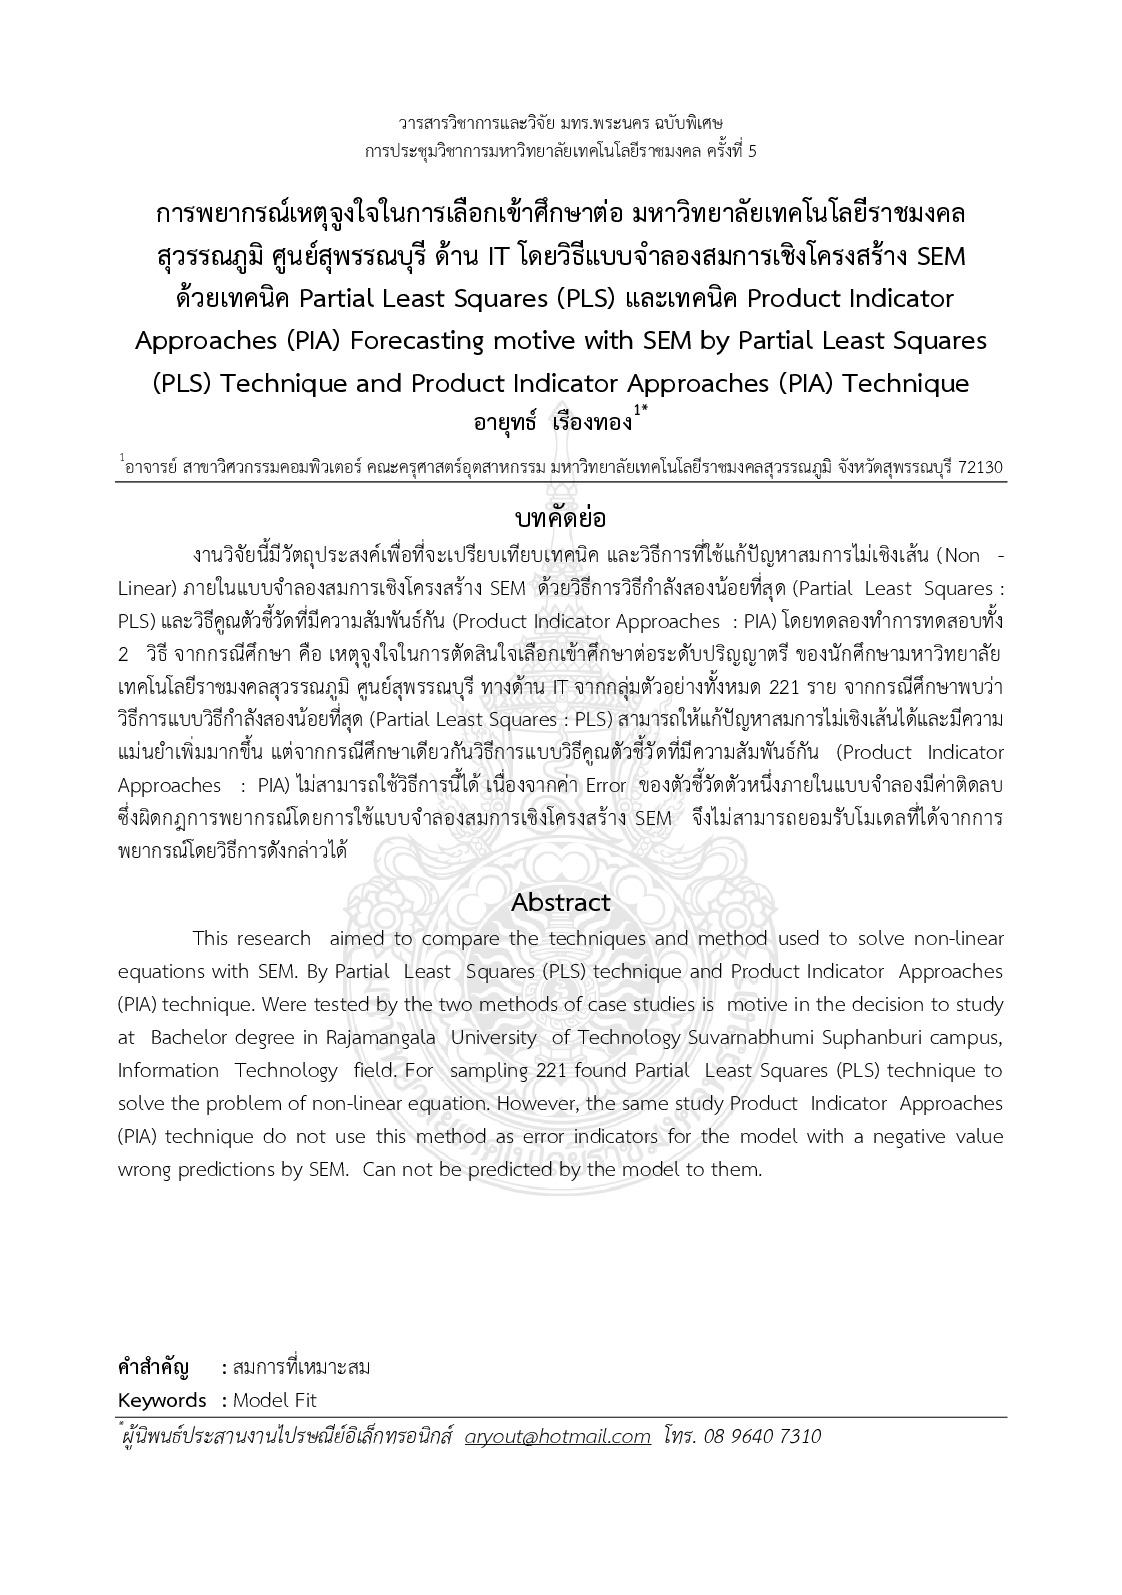
Approaches (PIA) forecasting motive with SEM by partial least squares (PLS) tchnique and product indicator approaches (PIA) technique
This research aimed to compare the techniques and method used to solve non-linear equations with SEM. By Partial Least Squares (PLS) technique and Product Indicator Approaches (PIA) technique. Were tested by the two methods of case studies is motive in the decision to study at Bachelor degree in Rajamangala University of Technology Suvarnabhumi Suphanburi campus Information Technology field. For sampling 221 found Partial Least Squares (PLS) technique to solve the problem of non-linear equation. However the same study Product Indicator Approaches (PIA) technique do not use this method as error indicators for the model with a negative value wrong predictions by SEM. Can not be predicted by the model to them.

การทบทวนวรรณกรรมอย่างเป็นระบบและวิเคราะห์อภิมานคุณลักษณะที่สำคัญด้านวิทยาการหุ่นยนต์เพื่อการศึกษา
This article aims to synthesize literatures in Educational Robotics and presents key features of systematic literature review and structured meta-analysis of the literature. Population consists of 247 papers from 10 databases ranging from 1996 to 2012. Results show that common problems in Educational Robotics are high cost of tools license and differences in students’ background knowledge. Trends of existing researches focus on development of software and low cost robot training package in order to promote students’ practice in problem-solving skills and teamwork in experience-based learning to enhance self-motivation and experience with real world applications. It was also found from the synthesis that qualitative-based evaluation of tool and learning achievement process was rare even though it is a key factor that indicates quality of learning process.
Spatial mathematical analysis : an application to mapping of dengue hemorrhagic fever in Thailand
The objectives of this research are to estimate the morbidity rate of Dengue Hemorrhagic fever in each province of Thailand and to construct the map of the Dengue Hemorrhagic fever. A Bayesian model is used for the data analysis. The data are mathematical spatial correlated in the form of the conditional autoregressive model (CAR). The secondary data were collected at a provincial level. They were the number of Dengue Hemorrhagic fever patients rainfall and average temperature. The research found that the rainfall (RR = 1.0026) and the average temperature (RR = 1.2681) had influence on the morbidity of Dengue Hemorrhagic fever. The season during July to September had more influence on the morbidity of Dengue Hemorrhagic fever than during the other seasons. The top 5 highest morbidity rates per 100000 population were Chiangmai in October (1288.00) July (1096.00) September (804.30) Surin in October (772.30) and Nakhon Si Thammarat in August (666.20). The disease map constructed for showing the distribution of the disease is easy to understand and useful for public health.