จำนวน Repository ( 1852 )

Study of effects of surface roughness 10 hardness test V2.Lv5
The objective of this work is to study the effect of the surface roughness on the measured hardness. The preparation of the surface roughness level complied with the ISO 1302: 1992 standard. There are many factors influencing surface roughness such as building mac uncry feed rate speed machine settings cutter and water cooling. The surface roughness C.tU. by these factors will have influence on the measured hardness of materials. The SKS3 is used as material in this study. Surface of the work piece was adjusted with different roughness val es divided following four levels: 12-50 urn rough machined 1.6-6.3 urn smooth turned 0.2-0.8 urn and 0.025-0.1 um. Then all the adjusted roughness work pieces were harden. After the Harden process the hardness of all work pieces were 62-64 HRC. From the measured hardness results it was found that the standard deviations are 4.665 1.0310.530 and 0.407 respectively with surface roughness value. Therefore it can be concluded that the standard deviation of hardness increased when the surface roughness increased
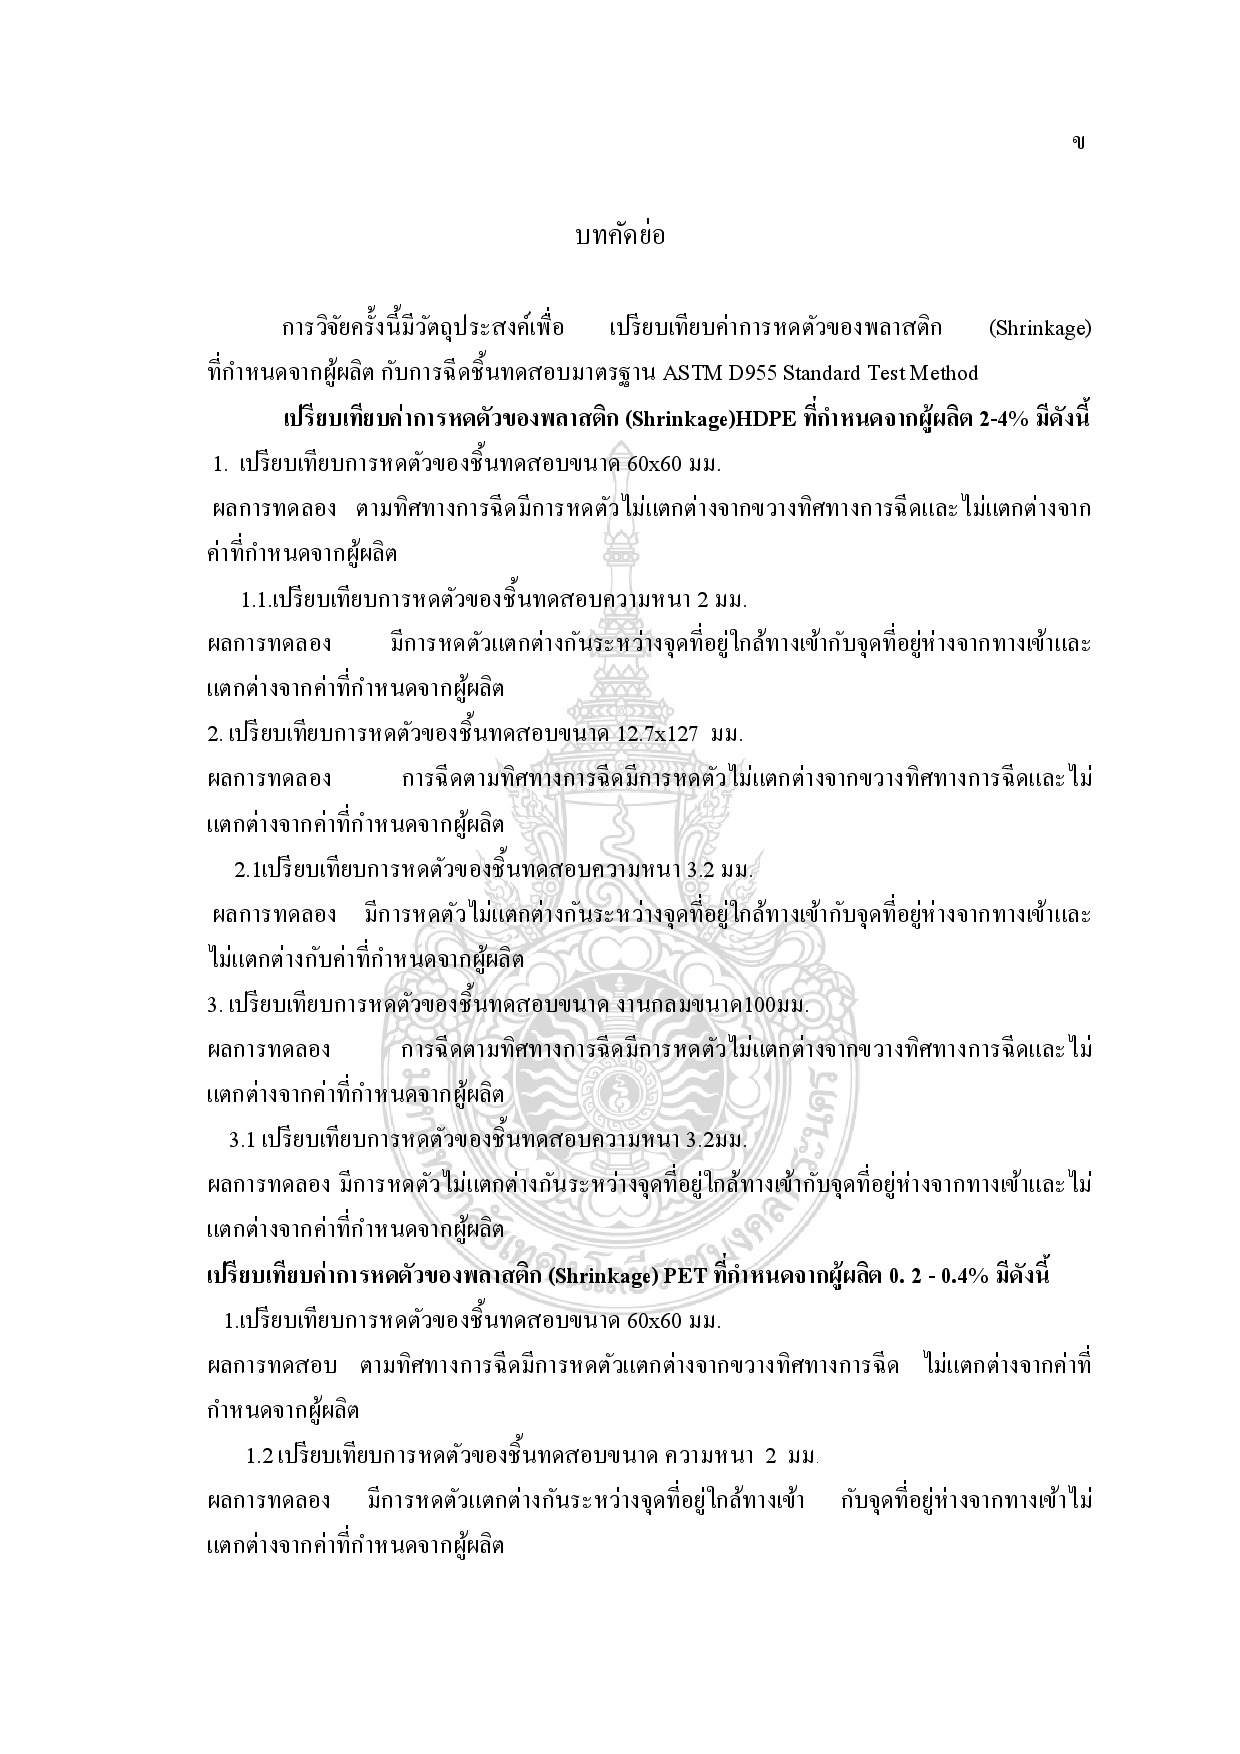
This research aims to compare the shrinkage value that limited from manufacturer with the ASTM D955 Standard Test Method
Comparing the shrinkage values of HDPE 2 – 4 % that limited from manufacturer are as the following: 1. Comparing the shrinkage of 60 X 60 mm. specimen The result showed that there aren’t any shrinkage differences among follow the injection across the injection and the limited value from the manufacturer. 1.1 Comparing the shrinkage of the specimen with 2 mm. thick The result showed that the shrinkage between at the point nearby the entrance is different from at the point further from the entrance and it is also different from the limited value from the manufacturer. 2. Comparing the shrinkage of 12.7 X 27 mm. specimen The result showed that there aren’t any shrinkage differences among follow the injection across the injection and the limited value from the manufacturer. 2.1 Comparing the shrinkage of the specimen with 3.2 mm. thick The result showed that there aren’t any shrinkage differences among the point nearby the entrance the point further from the entrance and the limited value from the manufacturer. 3. Comparing the shrinkage of 100 mm. round specimen The result showed that there aren’t any shrinkage differences among follow the injection across the injection and the limited value from the manufacturer. 3.1 Comparing the shrinkage of the specimen with 3.2 mm. thick The result showed that there aren’t any shrinkage differences among the point nearby the entrance the point further from the entrance and the limited value from the manufacturer. Comparing the shrinkage values of PET 0.2 - 0.4% that limited from manufacturer are as the following: 1. Comparing the shrinkage of 60 X 60 mm. specimen The finding revealed that the shrinkage value of the follow injection is different from the across injection but it is not different from the limited value from the manufacturer. 1.2 Comparing the shrinkage of the specimen with 2 mm. thick The finding revealed that the shrinkage value between the point nearby the entrance and the point further from the entrance are different but the same as the limitation from the manufacturer. 2. Comparing the shrinkage of 12.7 X 27 mm. specimen The finding revealed that the shrinkage value of the follow injection is different from the across injection but the same as the limited value from the manufacturer. 2.1 Comparing the shrinkage of the specimen with 3.2 mm. thick The result showed that there aren’t any shrinkage differences among follow the injection across the injection and the limited value from the manufacturer. 3. Comparing the shrinkage of 100 mm. round specimen The finding revealed that the shrinkage value of the follow injection is different from the across injection but it is not different from the limited value from the manufacturer. 3.1 Comparing the shrinkage of the specimen with 3.2 mm. thick The finding revealed that the shrinkage value of the follow injection the across injection and the limited value from the manufacturer are the same. Both comparing HDPE and PET have statistical significance at 0.05
การพัฒนาวัสดุจีโอโพลีเมอร์จากเถ้าแกลบและเถ้าชานอ้อย
This research studies the potential for using waste ash from industrial and agricultural by–products as a geopolymer material. This paper presents a study of the resistance to chloride penetration and resistance to sulfuric acid of geopolymer mortar containing ground rice husk ash (RA) and ground bagasse ash (BA). Geopolymer mortars with constant liquid to ash ratio and similar flow were used for the tests. Compressive strength porosity chloride penetration test Rapid migration test of chloride depth chloride ion diffusion coefficient immersion test of chloride depth and weight loss with impressed sulfuric acid were investigated. Test results show that the workable flow of geopolymer mortar was in the range of 110–115% and was dependent on the ratio by mass of sodium silicate to NaOH and the concentration of NaOH. Extra water was used to improve the workabililty. In case of rice husk ash geopolymer mortar the geopolymer mortars with high strengths were obtained with concentration of NaOH of 15M with the sodium silicate to NaOH ratio by weight of 2.5. However the bagasee ash geopolymer mortars with high strengths were obtained with concentration of NaOH of 10M with the sodium silicate to NaOH ratio by weight of 2.5. The use of rice husk ash and bagasse ash produces geopolymer mixes with good strength and resistance to acid and chloride penetration. The resistance to acid and chloride penetration is higher with an increase in the sodium silicate to NaOH ratio by weight of 2.5.
Behavior academic dishonesty among students in Rajamangala University of Technology Phra Nakhon
การวิจัยครั้งนี้มีวัตถุประสงค์เพื่อศึกษาและเปรียบเทียบพฤติกรรมไม่ซื่อสัตย์ทางวิชาการของนักศึกษามหาวิทยาลัยเทคโนโลยีราชมงคลพระนครจำแนกตามตัวแปรเพศ คณะที่ศึกษาอยู่ และผลการศึกษาเฉลี่ยสะสม และหาความสัมพันธ์ระหว่างตัวแปรสถานการณ์ ตัวแปรจิตลักษณะเดิมของบุคคล ตัวแปรจิตลักษณะตามสถานการณ์ กับพฤติกรรมไม่ซื่อสัตย์ทางวิชาการของนักศึกษามหาวิทยาลัยเทคโนโลยีราชมงคลพระนครทั้ง 9 คณะ ในภาคเรียนที่ 1 ปีการศึกษา 2553 เครื่องมือที่ผู้วิจัยใช้ในการเก็บรวบรวมข้อมูลครั้งนี้ เป็นแบบสอบถาม การวิเคราะห์ข้อมูลใช้ค่าสถิติ ร้อยละ ค่าเฉลี่ย ส่วนเบี่ยงเบนมาตรฐาน สถิติที การวิเคราะห์ความแปรปรวน และค่าสัมประสิทธิ์สหพันธ์ ผลการวิจัย พบว่า นักศึกษาส่วนใหญ่ไม่เคยกระทำความไม่ซื่อสัตย์ทางวิชาการ ประมาณ 56.96 ส่วนนักศึกษาที่รายงานว่าตนเคยกระทำพฤติกรรมไม่ซื่อสัตย์ทางวิชาการ ส่วนใหญ่เป็นการลอกแบบฝึกหัด รองลงไปเป็นการทุจริตในการสอบ และไม่ซื่อสัตย์ในการทำรายงาน พฤติกรรมไม่ซื่อสัตย์ทางวิชาการระหว่างนักศึกษาชายกับนักศึกษาหญิง โดยภาพรวมและรายด้านไม่แตกต่างกันอย่างมีนัยสำคัญทางสถิติที่ระดับ .05 แต่เมื่อจำแนกตามคณะที่ศึกษาและจำแนกตามผลการศึกษาเฉลี่ยสะสม พบว่า โดยภาพรวมแตกต่างกันอย่างมีนัยสำคัญทางสถิติที่ระดับ .05 และเมื่อพิจารณาตามด้านพบว่า ด้านความไม่ซื่อสัตย์ในการทำรายงาน และด้านการทุจริตในการสอบ มีพฤติกรรมไม่ซื่อสัตย์ทางวิชาการแตกต่างกันอย่างมีนัยสำคัญทางสถิติที่ระดับ .05 ส่วนด้านการลอกแบบฝึกหัดมีพฤติกรรมไม่ซื่อสัตย์ทางวิชาการแตกต่างอย่างไม่มีนัยสำคัญทางสถิติที่ระดับ .05 การทดสอบความสัมพันธ์ระหว่างตัวแปร พบว่า พฤติกรรมไม่ซื่อสัตย์ทางวิชาการ มีความสัมพันธ์ในทิศทางเดียวกันกับตัวแปรสถานการณ์ และตัวแปรจิตลักษณะตามสถานการณ์อย่างมีนัยสำคัญทางสถิติ 0.05

Uniqueness and Form of the Rice - and - Curry Fast Food Type of Thai Restaurant Business in Southern Part of Thailand
The research on uniqueness and form of the rice-and-curry fast-food type of Thai restaurant business in southern part of Thailand is a combined quantitative and qualitative research which aims to study the uniqueness of the rice-and-curry fast-food type of Thai restaurant business in terms of raw materials and cooking method. It has three main purposes: to study the form of the rice-and-curry fast-food type of Thai restaurant business in terms of administration decoration and sale in order to compare the uniqueness of Thai rice-and-curry fast-food in each province; to compare the form of rice-and-curry fast-food type of Thai restaurant business in each province; and to organize standard recipes for Thai rice-and-curry fast-food in southern provinces of Thailand. The sample used in this research were rice-and-curry fast-food shops from Nakhon Sri Thammarat Krabi Phang-nga Songkhla and Satun provinces - 5 shops each - with a total of 25 shops. The tool used in this study consisted of survey questionnaire food test questionnaire and record form for food recipe raw materials and equipment. Data were collected bymeans of survey and interview and were statistically analyzed for frequency and percentage together with a qualitative analysis.