จำนวน Repository ( 62 )

Study of effects of surface roughness 10 hardness test V2.Lv5
The objective of this work is to study the effect of the surface roughness on the measured hardness. The preparation of the surface roughness level complied with the ISO 1302: 1992 standard. There are many factors influencing surface roughness such as building mac uncry feed rate speed machine settings cutter and water cooling. The surface roughness C.tU. by these factors will have influence on the measured hardness of materials. The SKS3 is used as material in this study. Surface of the work piece was adjusted with different roughness val es divided following four levels: 12-50 urn rough machined 1.6-6.3 urn smooth turned 0.2-0.8 urn and 0.025-0.1 um. Then all the adjusted roughness work pieces were harden. After the Harden process the hardness of all work pieces were 62-64 HRC. From the measured hardness results it was found that the standard deviations are 4.665 1.0310.530 and 0.407 respectively with surface roughness value. Therefore it can be concluded that the standard deviation of hardness increased when the surface roughness increased
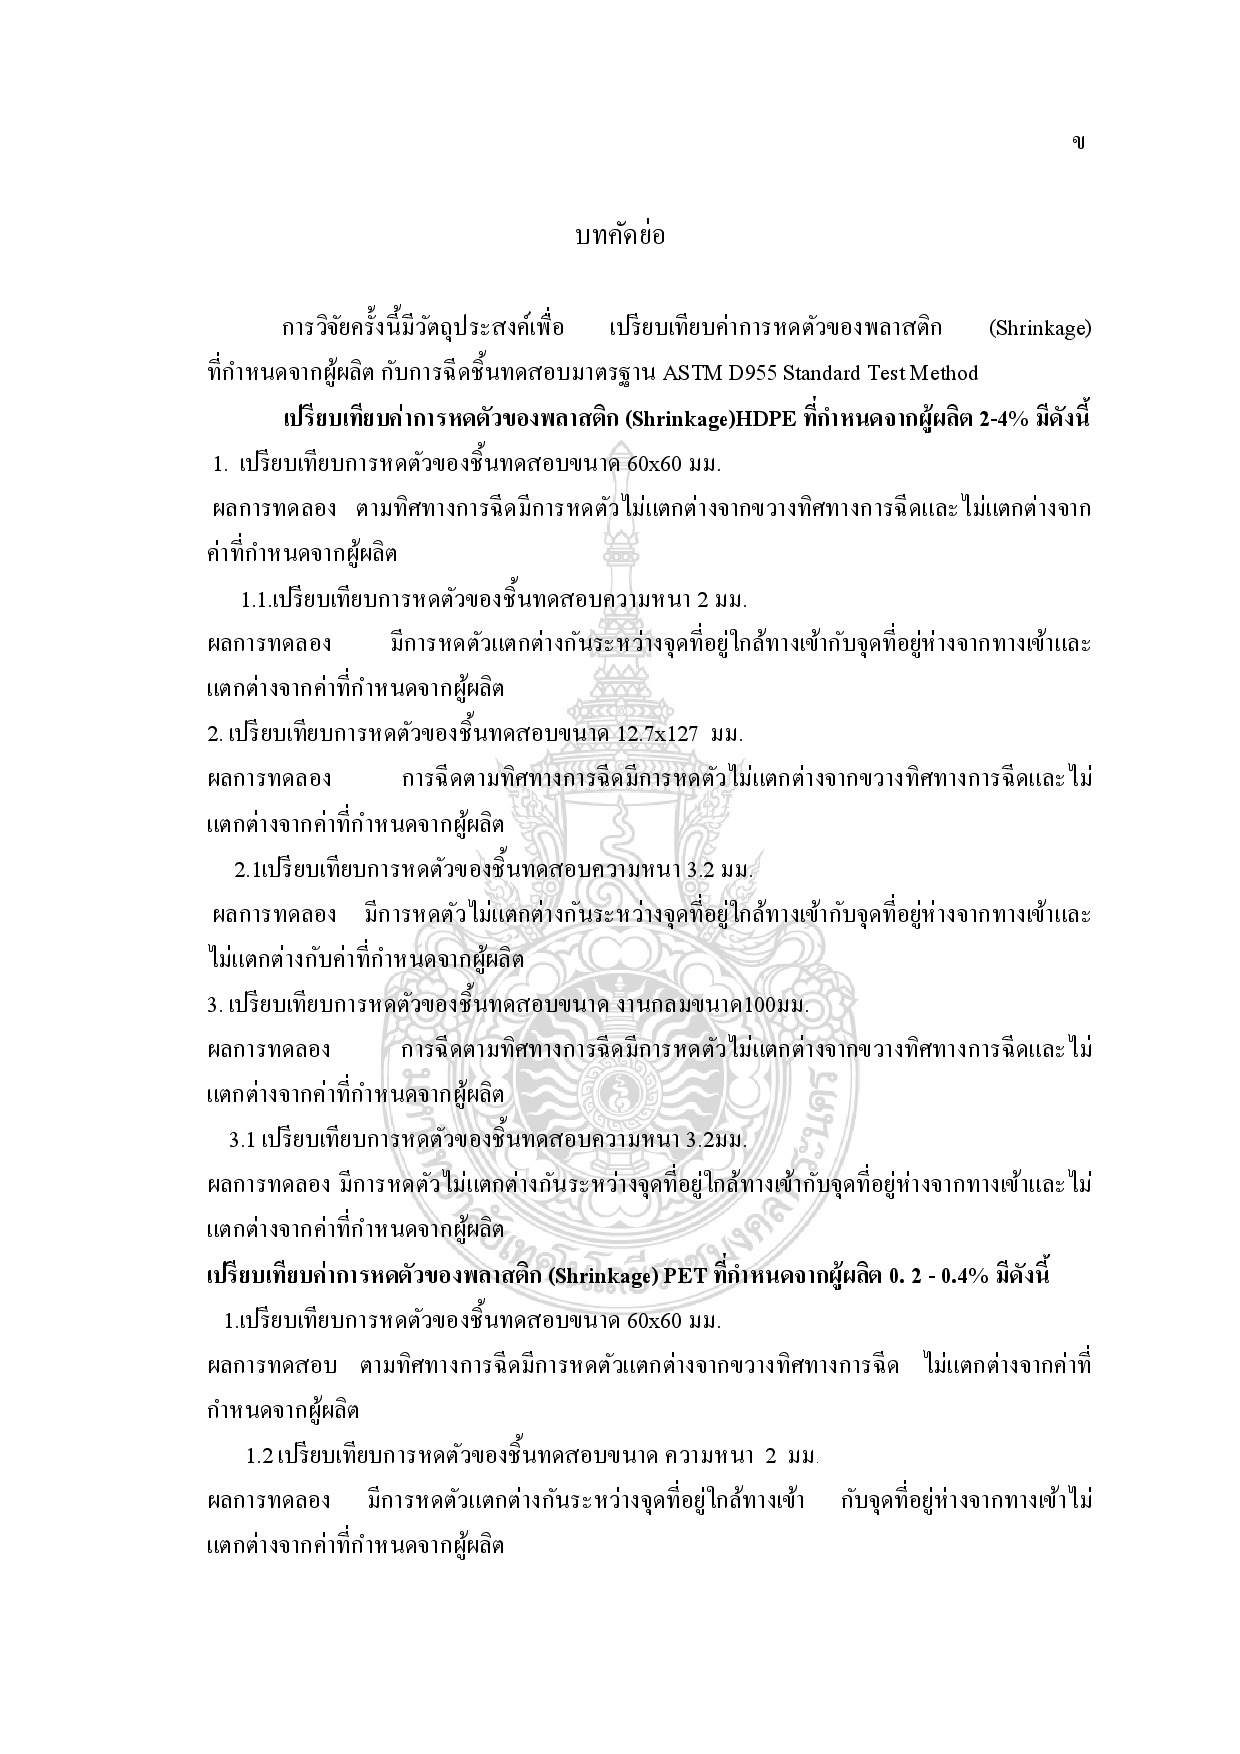
This research aims to compare the shrinkage value that limited from manufacturer with the ASTM D955 Standard Test Method
Comparing the shrinkage values of HDPE 2 – 4 % that limited from manufacturer are as the following: 1. Comparing the shrinkage of 60 X 60 mm. specimen The result showed that there aren’t any shrinkage differences among follow the injection across the injection and the limited value from the manufacturer. 1.1 Comparing the shrinkage of the specimen with 2 mm. thick The result showed that the shrinkage between at the point nearby the entrance is different from at the point further from the entrance and it is also different from the limited value from the manufacturer. 2. Comparing the shrinkage of 12.7 X 27 mm. specimen The result showed that there aren’t any shrinkage differences among follow the injection across the injection and the limited value from the manufacturer. 2.1 Comparing the shrinkage of the specimen with 3.2 mm. thick The result showed that there aren’t any shrinkage differences among the point nearby the entrance the point further from the entrance and the limited value from the manufacturer. 3. Comparing the shrinkage of 100 mm. round specimen The result showed that there aren’t any shrinkage differences among follow the injection across the injection and the limited value from the manufacturer. 3.1 Comparing the shrinkage of the specimen with 3.2 mm. thick The result showed that there aren’t any shrinkage differences among the point nearby the entrance the point further from the entrance and the limited value from the manufacturer. Comparing the shrinkage values of PET 0.2 - 0.4% that limited from manufacturer are as the following: 1. Comparing the shrinkage of 60 X 60 mm. specimen The finding revealed that the shrinkage value of the follow injection is different from the across injection but it is not different from the limited value from the manufacturer. 1.2 Comparing the shrinkage of the specimen with 2 mm. thick The finding revealed that the shrinkage value between the point nearby the entrance and the point further from the entrance are different but the same as the limitation from the manufacturer. 2. Comparing the shrinkage of 12.7 X 27 mm. specimen The finding revealed that the shrinkage value of the follow injection is different from the across injection but the same as the limited value from the manufacturer. 2.1 Comparing the shrinkage of the specimen with 3.2 mm. thick The result showed that there aren’t any shrinkage differences among follow the injection across the injection and the limited value from the manufacturer. 3. Comparing the shrinkage of 100 mm. round specimen The finding revealed that the shrinkage value of the follow injection is different from the across injection but it is not different from the limited value from the manufacturer. 3.1 Comparing the shrinkage of the specimen with 3.2 mm. thick The finding revealed that the shrinkage value of the follow injection the across injection and the limited value from the manufacturer are the same. Both comparing HDPE and PET have statistical significance at 0.05
Design and construction tesla transformer 120 kV 120 kHz for Insulator Testing
This research presented the details of design and constructions of tesla transformer for testing insulator. The out put of the tesla transformer has a rate of 120 kV and 120 kHz. Tesla transformer consisted of primary coil and secondary coil which is wound on a PVC insulating chamber and use air insulation in part of coaxial. The Rotary Gap is rotated eletrode which use for increasing efficiency of voltage generation. This paper presented the details of design and constructions are explained. And compare the tesla Transformer reproduce which is created the voltage at 120 kV and frequency 120 kHz for used in HighVoltage Laboratory Faculty of Engineering Rajamangala University of Technology Para Nakhon.
Creating and Finding Efficiency Validation of Computer Assisted Instruction Focused on the Practiced to Torsion Test
The purposes of the research were to create and find efficiency validation of computer assisted instruction focused on the practice to Torsion Test for the standard 90/90 and analyze the students learning achievement after using computer assisted instruction. The samples were the 20 first year Bachelor of Engineering Program in Industrial Engineering Rajamangala University of Technology Phra Nakhon. The researcher experimented by using pretest and then using the computer assisted instruction focus on the practice to Torsion Test in learning next the students did the posttest. After that the researcher calculated to find the computer assisted instruction efficiency and analyzed the students learning achievement after studying. The result revealed that the computer assisted instruction efficiency was efficient for standard 90/90. And after studying by using computer assisted instruction the students learning achievement increased significantly at 0.05.
Creating and Finding Efficiency Validation of Computer Assisted Instruction Focused on the Practiced to Hardness Test
The purposes of the research were to create and find efficiency validation of Computer Assisted Instruction Focused on the Practiced to Hardness Test for the standard 90/90 and analyze the students’ learning achievement after using computer assisted instruction. The samples were the 20 first year Bachelor of Engineering program in lndustrial Engineering Rajamangala University of Technology Phra Nakhon North Bangkok Campus.