จำนวน Repository ( 5 )
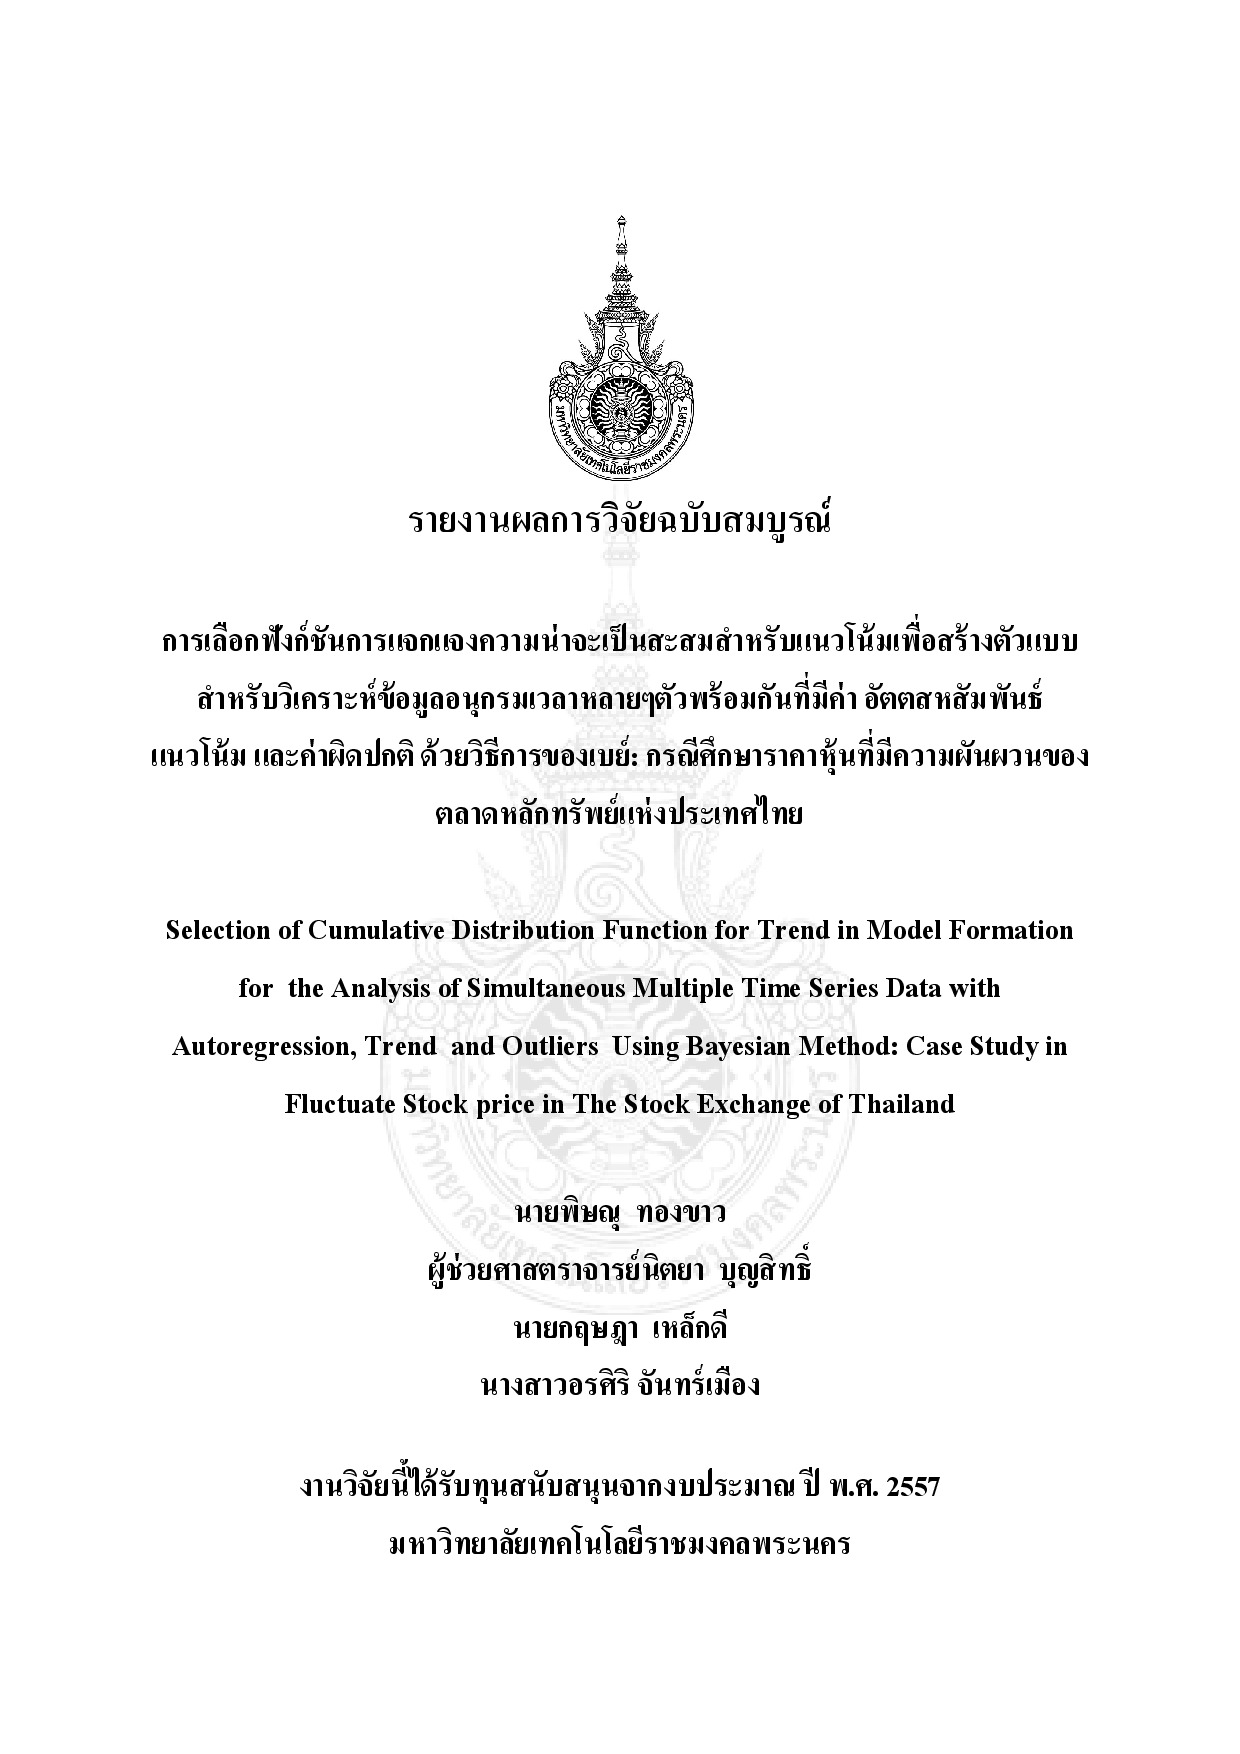
การเลือกฟังก์ชันการแจกแจงความน่าจะเป็นสะสมสำหรับแนวโน้มเพื่อสร้างตัวแบบสำหรับวิเคราะห์ข้อมูลอนุกรมเวลาหลายๆตัวพร้อมกันที่มีค่า อัตตสหสัมพันธ์แนวโน้ม และค่าผิดปกติ ด้วยวิธีของเบย์: กรณีศึกษาราคาหุ้นที่มีความผันผวนของตลาดหลักทรัพย์แห่งประเทศไทย
The objective of this research is to select a proper cumulative function for trend in an analysis of simultaneous multiple time series data with autocorrelation trend and outliers using a Bayesian method. The proposed model is applied to fluctuate stock price data in the stock exchange of Thailand. The data consist of the closing prices of 5 stocks. The algorithms are written in OpenBUGS and the performance of the model is evaluated via a simulation study in R. The cumulative distribution functions considered here are a Weibull cumulative distribution function and an exponential cumulative distribution. They are compared using RMSE MAPE and MAE as criteria. The research found that an exponential cumulative function for trends gives smaller values of the three criteria in both model fitting and model validation for the4 stocks EA NWR and KTB. However a Weibull cumulative distribution function gives smaller values of three criteria for the PTT in both model fitting and model validation.
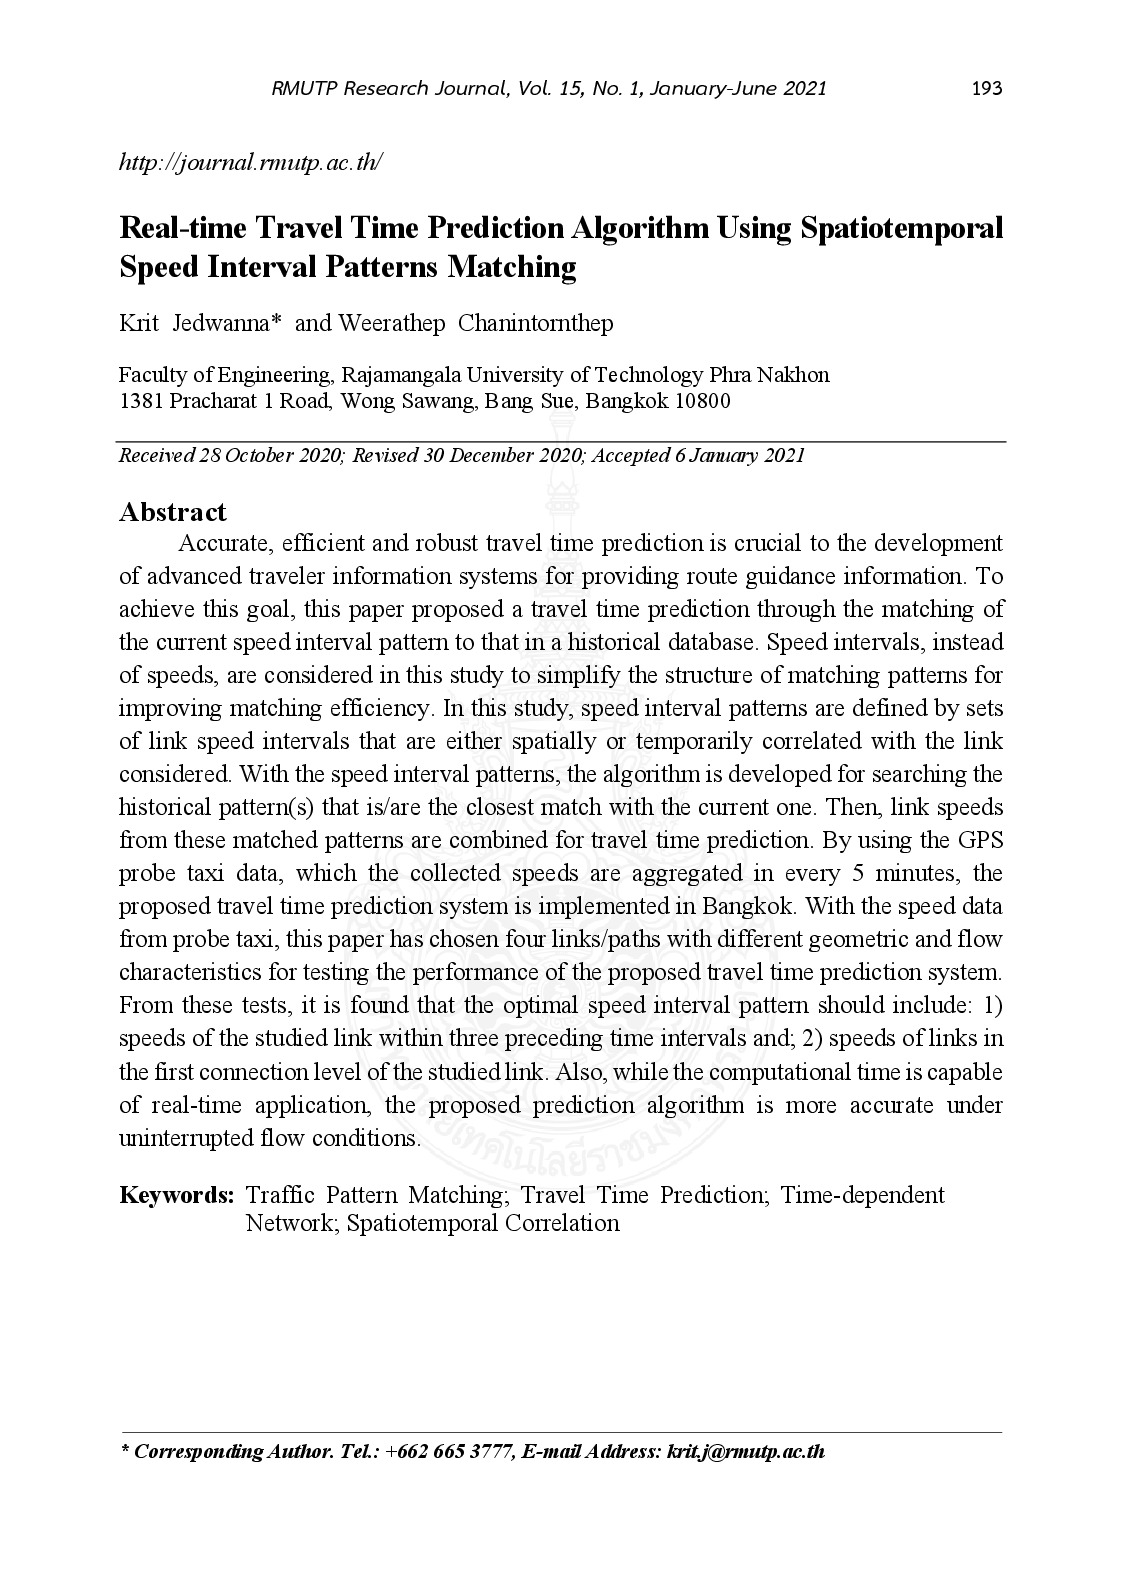
Real-time travel time prediction algorithm using spatiotemporal speed interval patterns matching
Accurate efficient and robust travel time prediction is crucial to the development of advanced traveler information systems for providing route guidance information. To achieve this goal this paper proposed a travel time prediction through the matching of the current speed interval pattern to that in a historical database. Speed intervals instead of speeds are considered in this study to simplify the structure of matching patterns for improving matching efficiency. In this study speed interval patterns are defined by sets of link speed intervals that are either spatially or temporarily correlated with the link considered. With the speed interval patterns the algorithm is developed for searching the historical pattern(s) that is/are the closest match with the current one. Then link speeds from these matched patterns are combined for travel time prediction. By using the GPS probe taxi data which the collected speeds are aggregated in every 5 minutes the proposed travel time prediction system is implemented in Bangkok. With the speed data from probe taxi this paper has chosen four links/paths with different geometric and flow characteristics for testing the performance of the proposed travel time prediction system. From these tests it is found that the optimal speed interval pattern should include: 1) speeds of the studied link within three preceding time intervals and; 2) speeds of links in the first connection level of the studied link. Also while the computational time is capable of real-time application the proposed prediction algorithm is more accurate under uninterrupted flow conditions.

การวิเคราะห์ผลผลิต และราคาข้าวในประเทศไทยอย่างมีประสิทธิภาพโดยใช้ฟังก์ชันฤดูกาล และแนวโน้มในตัวแบบอนุกรมเวลาที่เหมาะสม
This research aims to apply the principle of stochastic process for modeling. The parameters are estimated using Bayesian methods. The monthly average real price of paddy rice 15% and yield of paddy rice in Thailand were studied. The price and the yield of paddy rice which are time series data consisting of four components autocorrelation an exponential cumulative distribution function for trend outliers and two different types of seasons: the dummy seasons and Fourier function seasons. Writing algorithms programming in OpenBUGS and evaluating the performance of models from simulation programming in R were conducted. After that Bayesian methods with dummy seasons and Fourier function season were compared using RMSE MSE and MAE as the criteria. The results show that the Bayesian model with an exponential cumulative distribution function for trend and dummy seasons give the lowest RMSE MSE and MAE for both model fitting and model validating.
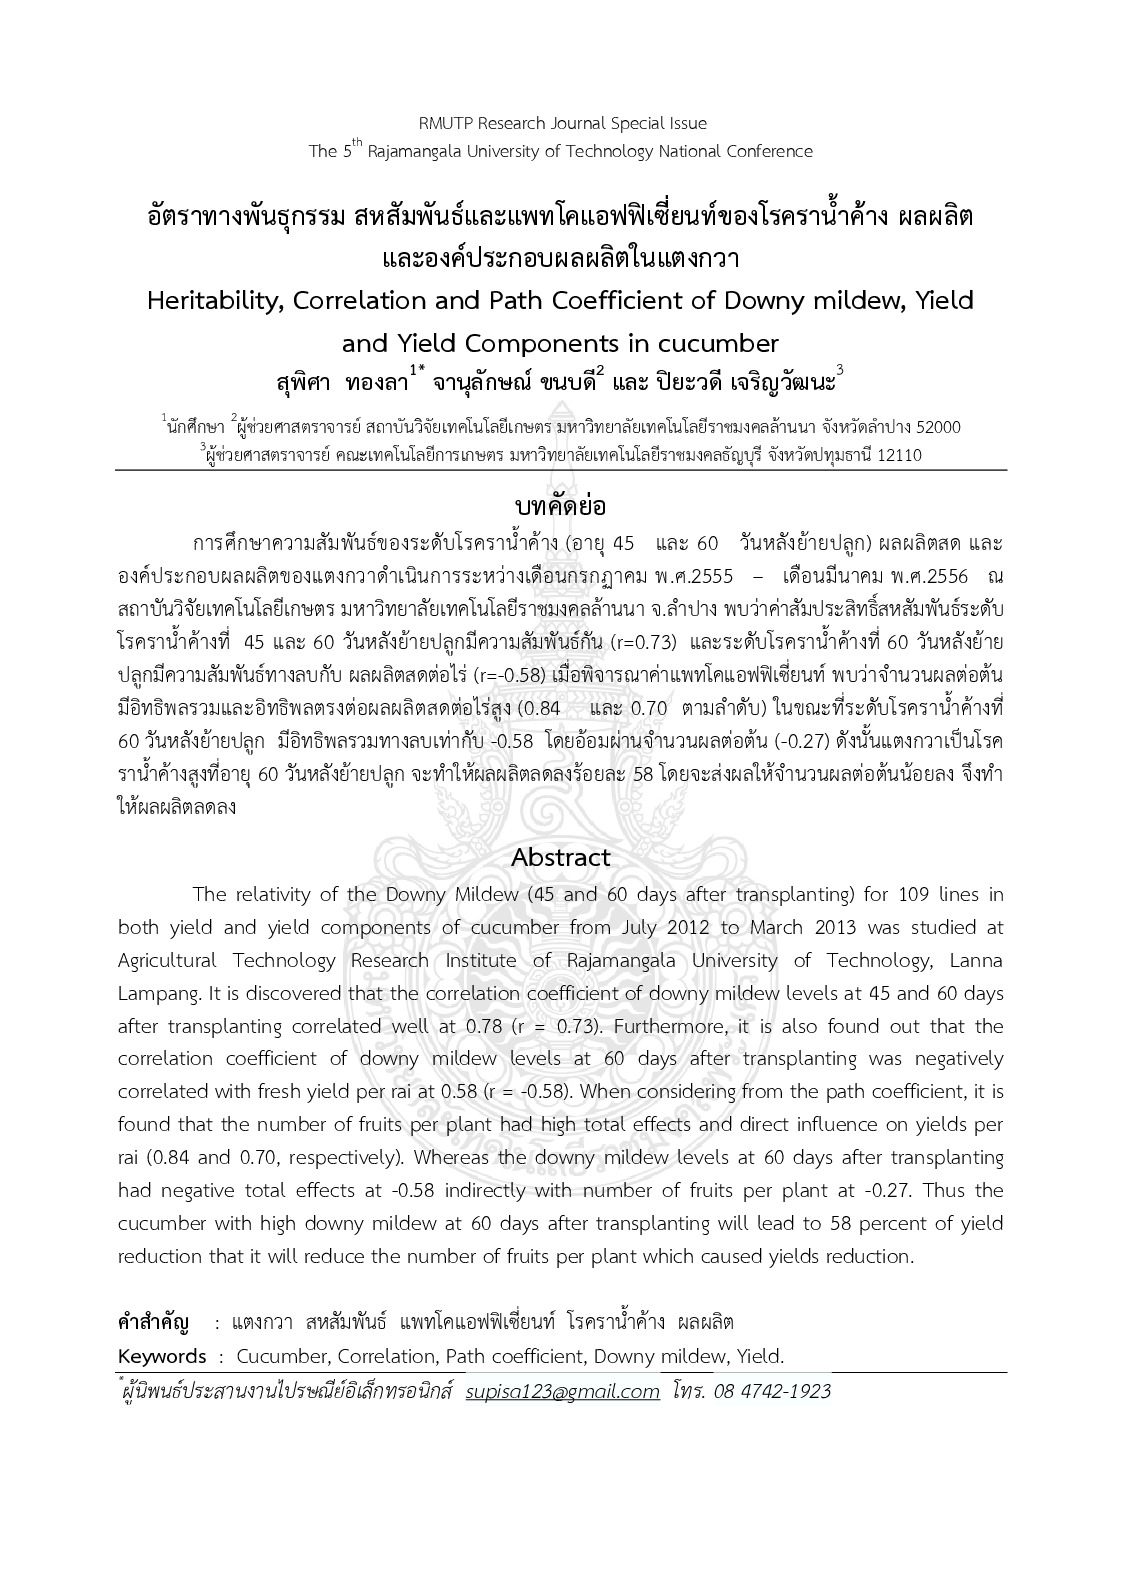
Heritability, correlation and path coefficient of downy mildew, yield and yield components in cucumber
The relativity of the Downy Mildew (45 and 60 days after transplanting) for 109 lines in both yield and yield components of cucumber from July 2012 to March 2013 was studied at Agricultural Technology Research Institute of Rajamangala University of Technology Lanna Lampang. It is discovered that the correlation coefficient of downy mildew levels at 45 and 60 days after transplanting correlated well at 0.78 (r = 0.73). Furthermore it is also found out that the correlation coefficient of downy mildew levels at 60 days after transplanting was negatively correlated with fresh yield per rai at 0.58 (r = -0.58). When considering from the path coefficient it is found that the number of fruits per plant had high total effects and direct influence on yields per rai (0.84 and 0.70 respectively). Whereas the downy mildew levels at 60 days after transplanting had negative total effects at -0.58 indirectly with number of fruits per plant at -0.27. Thus the cucumber with high downy mildew at 60 days after transplanting will lead to 58 percent of yield reduction that it will reduce the number of fruits per plant which caused yields reduction.
Forecasting model for the export quantity of concentrated latex
The objective of this research is to construct the appropriate forecasting model for the export quantity of concentrated latex by the three time series analysis methods which are Box-Jenkins method Winters’ multiplicative exponential smoothing method and combined forecasting method. Time series data from the website of Office of Agricultural Economics during January 1998 to February 2014 (194 values) are used and divided into two series. The first 182 values from January 1998 until February 2013 for the models prediction and the last 12 values from March 2013 until February 2014 for comparison the performance of forecasting models via the criterion of the lowest root mean squared error and the criterion of the highest correlation coefficient between existing values and forecasted values. Research findings indicated that for all forecasting methods that have been studied the most powerful method is the combined forecasting and the forecasting model is where and represent the single forecasts at time t from Box-Jenkins method and Winters’ multiplicative exponential smoothing method respectively.