จำนวน Repository ( 27 )

The potential predictability of the northeast monsoon forecasts by the educational global climate model as measured by the supremum lyapunov exponent
Weather predictions by an atmospheric model are determined by the uncertainties in the initial condition and the imperfection of the model. It is difficult to provide accurate weather prediction. The efficiency of weather predictions model is obtained from the analyses of Lyapunov exponent. In addition the predictability measurements is applied from Lyapunov exponent are finite size Lyapunov exponent finite time Lyapunov exponent local Lyapunov exponent together with a new method called supremum Lyapunov exponent are used to measure predictability of the northeast monsoon (winter monsoon) by the Educational Global Climate Model (EdGCM) and to test sensitivity of the model to small initial perturbations. The EdGCM sensitive to initial perturbations it is suitable for predictability of the northeast monsoon. The EdGCM is run for 142-year predictions from the year 1958 to 2100. However only the outputs of geopotential height at 500hPa of December from 2012 to 2100 are used for predictability measurement. The results show that the EdGCM predictability for the northeast monsoon forecast is about 120 years. So the EdGCM can be predictability of the long range forecast. Supremum Lyapunov Exponent Click to buy NOW! PDF-XChange Viewer www.docu-track.com Click to buy NOW! PDF-XChange Viewer www.docu-track.com
Comparison of statistical techniques for forecasting set 100 index
This research is the comparative study of three forecasting methods on SET 100 index. These methods are Simple Exponential Smoothing method Holts method and Box-Jenkins method. Two sets of data were used in this study. The first one used as a training set was collected from January 2 2008 to September 30 2011. The other one used as a testing set was collected from October 3 2011 to October 14 2011. We propose that the most appropriate forecasting method is the one which give the lowest MAE MSE MAPE and diagnostic checking. The results show that Holt’s method displays the lowest MAE MSE and MAPE. The next one is Box-Jenkins method while the Simple Exponential Smoothing method exhibits the highest value of all three indicators. However the model from Box-Jenkins method is the only one way that reveals no residual autocorrelation. This leads to the conclusion that the appropriate models for forecasting of SET 100 Index is ARIMA (213).
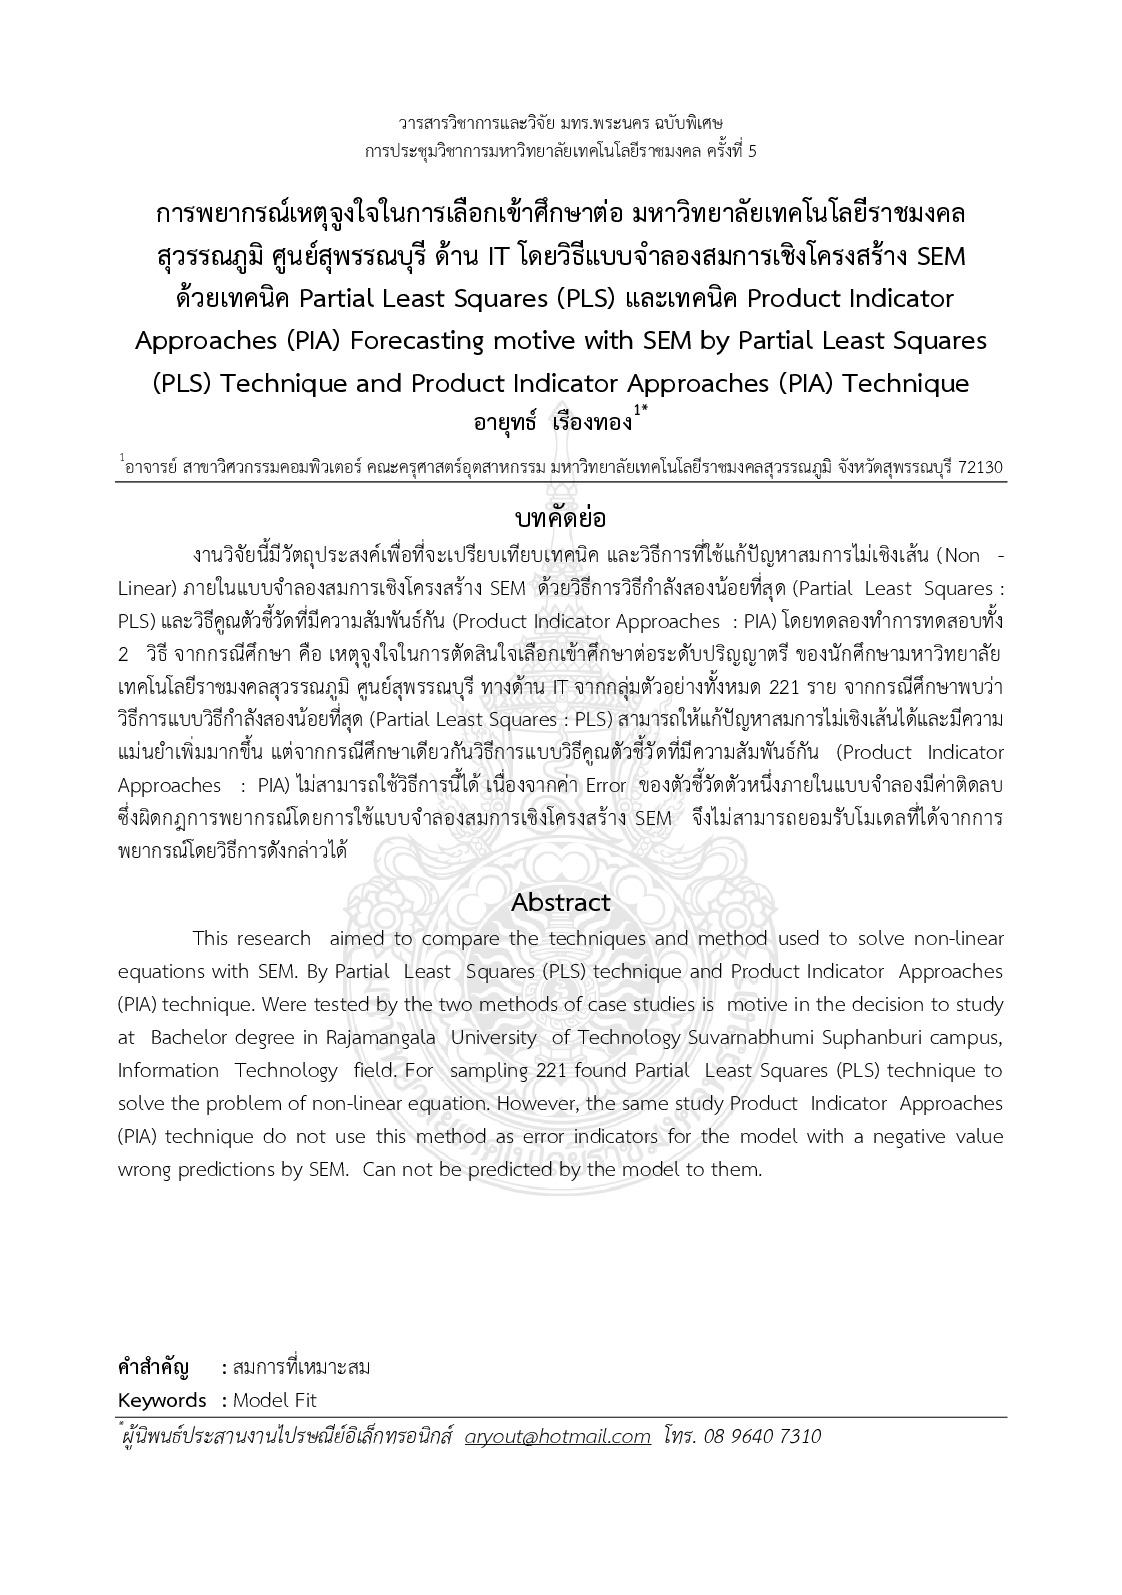
Approaches (PIA) forecasting motive with SEM by partial least squares (PLS) tchnique and product indicator approaches (PIA) technique
This research aimed to compare the techniques and method used to solve non-linear equations with SEM. By Partial Least Squares (PLS) technique and Product Indicator Approaches (PIA) technique. Were tested by the two methods of case studies is motive in the decision to study at Bachelor degree in Rajamangala University of Technology Suvarnabhumi Suphanburi campus Information Technology field. For sampling 221 found Partial Least Squares (PLS) technique to solve the problem of non-linear equation. However the same study Product Indicator Approaches (PIA) technique do not use this method as error indicators for the model with a negative value wrong predictions by SEM. Can not be predicted by the model to them.

ตัวแบบการพยากรณ์ความต้องการเหล็กภายใต้ความไม่แน่นอนโดยวิธีเบย์
The objective of this research is to propose a forecasting model for uncertain demand index data of steel. The forecasting model proposed by Yelland (2010) was modified by adjusting the prior distributions of some parameters in the model in order that it is suitable for the demand of steel in Thailand. The algorithms for model fitting were written in OpenBUGS. The proposed model was compared to a classical exponential smoothing model. The research found that the forecast errors from the proposed forecasting model were minimum.
Forecasting agricultural Products Prices by Exponential Smoothing
The objective of this study is to compare three forecasting methods on three agricultural products consisting of fresh whole chicken (include bone no entrails) red meat pork hip section and Jasmine rice. These methods are Simple Exponential Smoothing method Holt’s method and Winter’s method. Data are colleced for a period of 60 months from January 2007 to December 2011. The most suitable forecasting method are the one that shows no residual autocorrelation and gives the lowest MSE MAPE. The results show that Simple Exponential Smoothing method is the most suitable method on three agricultural products due to this method reveals no residual autocorrelation and displays the lowest MSE MAPE.